The Relative Strength Index (RSI) is a very popular Momentum Oscillator and was created by J. Welles Wilder, Jr. who first presented it in his landmark book New Concepts in Technical Trading Systems (June 1978).
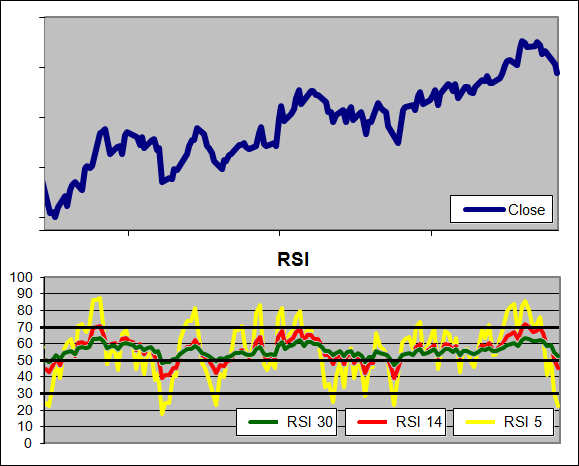
The RSI moves within a range from 0 to 100 and typically has an upper extreme zone above 70 and a lower extreme zone below 30. When in the upper extreme zone a stock is considered overbought and when in the lower extreme zone a stock is considered oversold. At such extremes the RSI suggests that a recent stock movement is likely to slow or reverse. Welles recommended a 14 period RSI but increasing the RSI period will decrease its volatility (and vice versa) as seen in the example below where three different RSI periods are overlaid:

The Relative Strength Index measures declines relative to advances over a specified period. This is done by averaging out the amount that a stock advanced on the days that it moved higher and the amount that stock declined on the days it moved lower. A modified ratio of these two averages is then charted creating a visual Relative Strength Index of bulls and bears.
Wells used his own smoothing method in the RSI known as Wilder’s Smoothing (WS-MA). Despite having a unique calculation method, WS-MA is actually identical to an EMA with a period of (2 * RSI Period) – 1. So an RSI(14) actually has an EMA period of 27 = (14 * 2) -1. Why care? Because it helps to maintain constancy between methods and measures when comparing indicators as we are in the Technical Indicator Fight for Supremacy.
For instance if we were to compare the Relative Momentum Index (RMI) to the RSI it would be helpful to compare them over equivalent look back periods so any patterns become evident. For this reason we use the EMA instead of the WS-MA in the Relative Strength Index.
How to Calculate the RSI
RSI = 100 – (100 / 1 + RS)
RS = EMA of Gains / EMA of Declines
EMA = EMA(1) + α * (Current change – EMA(1))
Where:
α = 2 / (N + 1)
N = (2 * RSI Period) – 1
RSI Period = User selected value but typically 14
Note:
Declines are expressed as their absolute value (all as positive).
Each EMA can be seeded with a SMA of the relevant Gains or Losses.
Free RSI Excel Download
To make life easy we have built a free Excel Spreadsheet for you to download containing an RSI that will automatically adjust to the look back period you set. You will find it at the following link under Technical Indicators.
How to use the RSI
Overbought/Oversold: Wilder suggested the upper and lower extremes of 70 and 30 as an indication of turning points. He said that when the RSI rises above 30 this is a bullish sign, with the opposite indication when the RSI falls below 70. Some traders, after identifying the long term trend of a stock will use extreme readings from the RSI as an entry point.
Divergences: Confirmation of the strength of a medium term bullish trend can be gained by looking for higher highs from the stock confirmed by higher highs from the RSI. In a similar fashion; a stock that is declining and making lower lows while the RSI is making higher lows may become a buying opportunity.
Centreline Crossover: The centreline on an RSI is 50, above this level we know that the average gain has been larger than the average decline over the look back period. Many traders look to see the RSI above or below 50 as confirmation before opening a long or short position.
Is the RSI a good indicator?
That is a great question, at a guess I would say yes but rather than guess we tested it through 300 years of data across 16 different global markets – See the Results.