The MACD is one of the most widely used technical indicators in the world and is included in every charting program worth owning. Unfortunately however, reliable data on its performance is almost non-existent. Are the standard settings of 26, 12, and 9 the best? To reveal the answer we tested 2000 different combinations through 300 years of data across 16 different global markets~. Stand by for the results below…
Download A FREE Spreadsheet With Data, Charts
And Results For all 2,000 MACDs Tested
.
MACD – Test Results:
.
- Our Testing Strategy Explained
- MACD Test Sets – Broad
- MACD Test Sets – Short Term Trading
- MACD Test Sets – Practical Trades: Long
- MACD Test Sets – Practical Trades: Short
.
Our Testing Strategy Explained
Because there are so many different possible settings for a MACD we started by testing a broad range with the hope this would reveal the areas to focus on more closely. To cast our testing range wide but strategically, we progressed in a liner fashion through the Fast Moving Averages (FC) and set the Slow Moving Averages (SC) as of multiple of the FC:
Fast Moving Averages (FC) = 10, 20, 30, 40, 50
Slow Moving Averages (SC) = 2 * FC, 3 * FC, 4 * FC, 5 * FC, 6 * FC
So each of the five FC settings were tested against five SC settings based on a multiple of the FC. e.g A SC of 50 would be tested against a FC of 100, 150, 200, 250, 300 as these are equal to 50 multiplied by 2, 3, 4, 5 and 6.
Each of these were tested against 10 different Signal Line settings:
Signal Line (SL) = 2, 4, 6, 8, 10, 12, 14, 16, 18, 20
Trading Rules:
An entry signal to go Long for each MACD tested was generated when the MACD Line was above zero AND above the Signal Line. The position was closed when the MACD Line moved below zero OR below the Signal Line (vice versa when going short)^.
If what you have read so far does not make much sense, please read more about the MACD before continuing 🙂
.
MACD Test Sets – Broad
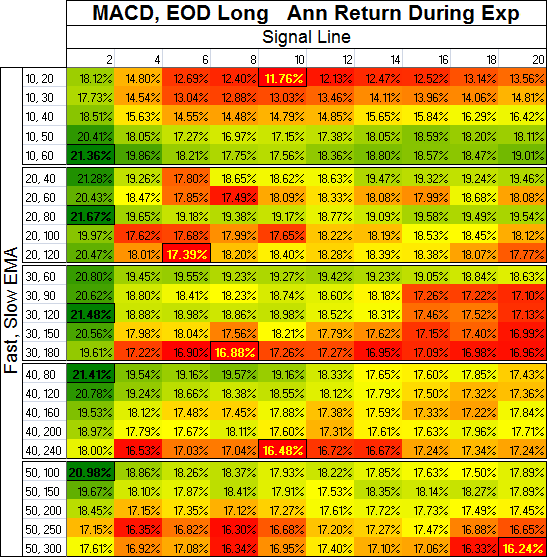
Above you can see the annualized return during the time each MACD was exposed Long to the market. Clearly the Signal Line setting is far more influential than the ‘Fast’ and ‘Slow’ Moving Averages (MACD Line). To my surprise having the Signal Line as fast as just 2 days produced the the best results and even more surprising is that the trades produced are not prohibitively short (8 – 27 days on average from the table above, see spreadsheet for full stats).
.
MACD Test Sets – Short Term Trading
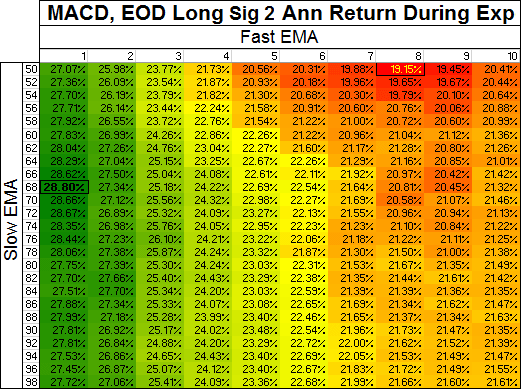
After refining the tests down several times we uncovered some interesting findings. Firstly the most efficient returns came from a MACD with a ‘Fast’ Moving Average of 1, which isn’t actually a MACD at all (a Moving Average with a period of 1 is equal to the price itself). So the best results come from measuring the Convergence and Divergence between an MA and the price, with the addition of a Signal Line. What is really exciting however is this also works exceptionally well on the Short side of the market:
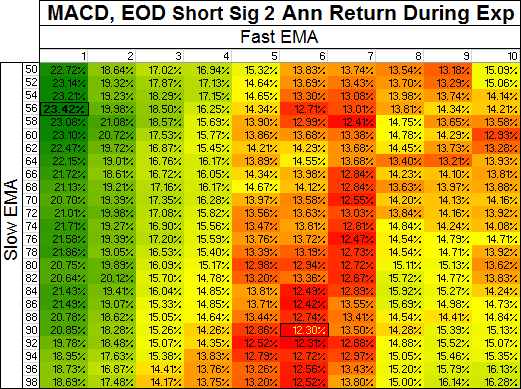
For me, when assessing a trading system, I am more interested in the return during exposure than the return overall. A system may have you exposed to the market for 30%, 70% or 99% of the time but the more time you are exposed to the market the more time your money is at risk. While my money is at risk, if it is not working hard, if I am not getting a high return, then I would rather sit in cash!
The Short side of the market is often not worth trading because decent returns during exposure are difficult to get from a mechanical system. What we see with the MACD however are returns during exposure then exceed even the best that the FRAMA could produce when Long…. Sooooo, what is the catch? Lets have a closer look:
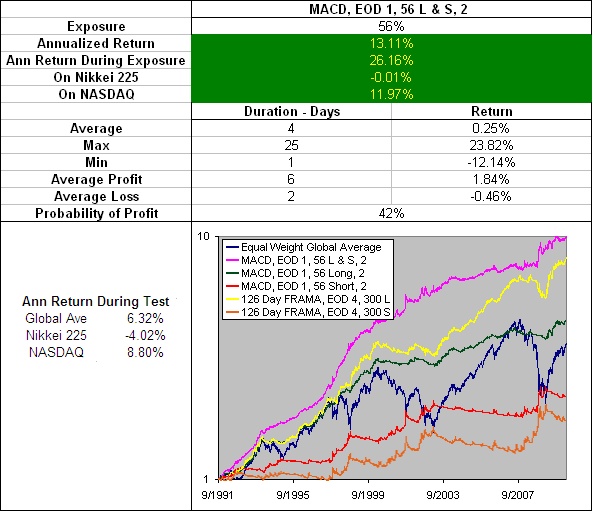
The pink line on the chart above is the performance, taking signals both Long and Short from a MACD with a ‘Fast’ MA of 1 (price), a ‘Slow’ MA of 56 and a Signal Line of 2. I have included the results from the best FRAMA for comparison.
The impressiveness of this MACD can’t be doubted; consider the fact that it achieves these returns while only being exposed to the market 56% of the time and delivers a 42% probability of profit for each trade. But can you see the problems? With an average return of just 0.25% and an average trade duration of 4 days, a MACD with these settings is limited in its practical applications.
Firstly you would need near frictionless trading, such as that offered by some index mutual funds (e.g. Rydex, ProFunds, or Direxion)
Secondly you would need to gain exposure to several diverse equity index funds. Part of the reason for the success of this strategy is the fact that it spreads the risk across 16 different global markets, some of which performed better than others in our tests. In the real world frictionless trading is not accessible to such a variety of indices.
Thirdly between 2003 and 2007 while the Global Average was experiencing a very strong bull market the MACD underperformed quite significantly.
.
MACD Test Sets – Practical Trades: Long
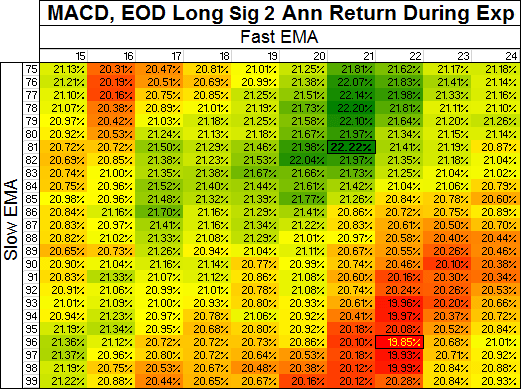
The table above is the result of a search for some more practical MACD settings. As you can see the best returns localise around the the 21/81 mark area:
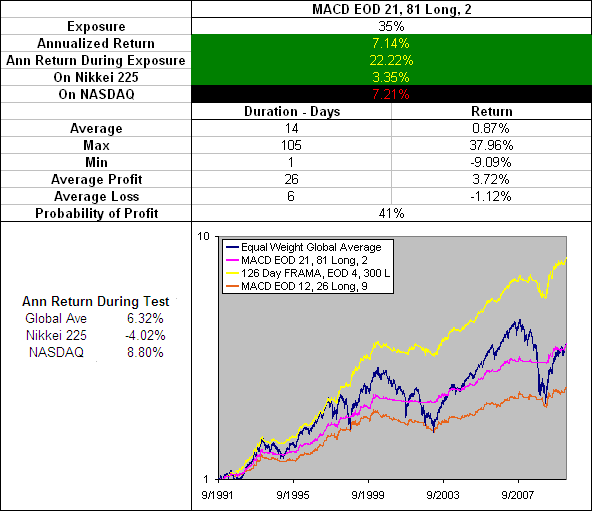
Above we are looking at the performance of a MACD going Long with a ‘Fast’ Moving Average of 21, a ‘Slow’ Moving Average of 81 and a signal line of 2 compared to the best FRAMA (also notice the poor performance from the standard MACD of 12, 26, 9 – See Full Stats).
Now when comparing the 21, 81, 2 MACD to the FRAMA it must be taken into consideration that the MACD is only exposed to the market 35% of the time while the FRAMA is exposed 57% of the time. So a side by side, total return comparison is not really fair. What is good to see however is the consistency and stability from the MACD during market declines. What I don’t like though is the familiar under-performance during the strong bull market between 2003 and 2007.
.
MACD Test Sets – Practical Trades Short
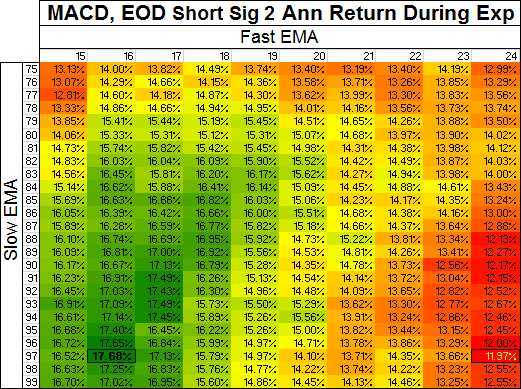
The Short side of the market behaves differently to the Long so it is not surprising to see that a more reactive MACD performs better, and the top returns were found around 16/97:
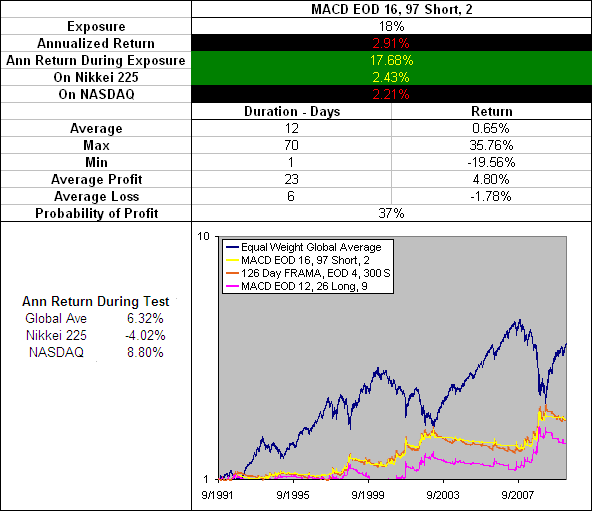
Above we are looking at the performance of a MACD going Short with a ‘Fast’ Moving Average of 16, a ‘Slow’ Moving Average of 97 and a signal line of 2 compared to the best FRAMA (also included is the standard MACD of 12, 26, 9 – See Full Stats).
The 16, 97, 2 MACD is quite exceptional, managing to match the returns from the FRAMA with 2/3 the market exposure and a higher probability of profit. These results are very exciting. It would appear as though the MACD’s true strength is in its ability to go Short.
.
MACD Conclusion
I have been a big fan of the MACD for a long time and had high expectations for these test results. But reality has been harsh on the MACD and in many ways the Emperor has no clothes.
In an attempt to limit the length of this article we only published results from trades off the Signal Line when the MACD line was above zero (when Long) or below zero (when short). Please note however that trying the trade the MACD when it is on the wrong side of zero will lead to an unhappy bank account, an unhappy wife and an unhappy life.
As a tool for long term trading the MACD fails and can’t compete with its less evolved relative the Moving Average Crossover.
As a tool for short term trading (4 days on average) the MACD is very powerful in theory but with such a small average return the practical applications are limited.
As a tool for medium term trading the MACD should not be your first choice on the Long side of the market BUT on the Short side the MACD is simply outstanding! Using a ‘Fast’ Moving Average of 16, a ‘Slow’ Moving Average of 97 and a signal line of 2 you have a powerful indicator for taming the bear.
More in this series:
We have conducted and continue to conduct extensive tests on a variety of technical indicators. See how they perform and which reveal themselves as the best in the Technical Indicator Fight for Supremacy.
- ~The data used for these tests is included in the results spreadsheet and more details about our methodology can be found here.
- ^ No interest was earned while in cash and no allowance has been made for transaction costs or slippage. Trades were tested using End Of Day (EOD) signals on Daily data. All Moving Averages (MA) in these tests were Exponential (EMA).
