The Vertical Horizontal Filter (VHF) was first presented by Adam White in an article published in the August, 1991 issue of Futures Magazine – Tuning into trendiness with VHF indicator. Trend following indicators work best in a trending market while in a range bound market, mean reversion strategies tend to excel. The Vertical Horizontal Filter is designed to determine if prices are in a trending or congestion phase so that the most appropriate trading strategy can be applied.
The Vertical Horizontal Filter can be interpreted in several different ways:
- Values can be used to indicate the strength of the trend; higher values equal a stronger trend.
- The VHF direction can be used to identify if a trending or congestion phase is developing.
- It can also be used as a contrarian indicator where extreme readings foretell of an impending change in the market phase.
.
How To Calculate the Vertical Horizontal Filter:
.
VHF = Numerator / Denominator
Where:
Denominator = n ∑ (ABS(Close – Close[1]))
Numerator = ABS (Max Close[n] – Min Close[n])
n = Number of Periods
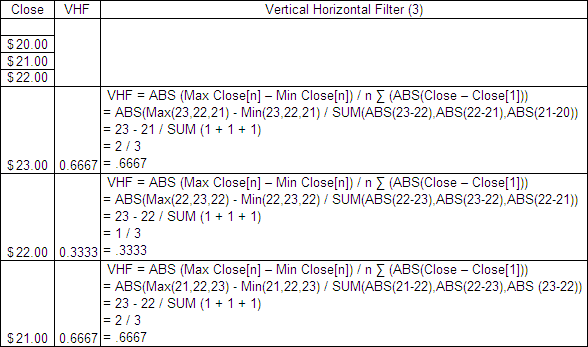
Here is an example of a 3 period VHF:
.
 .
.
Vertical Horizontal Filter Excel File
.
I have put together an Excel Spreadsheet containing the Vertical Horizontal Filter and made it available for FREE download. It contains a ‘basic’ version displaying the example above and a ‘fancy’ one that will automatically adjust to the length you specify. Find it at the following link near the bottom of the page under Downloads – Technical Indicators: Vertical Horizontal Filter (VHF)
.
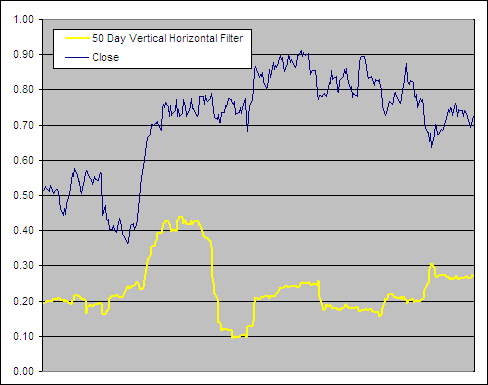
Vertical Horizontal Filter Example
.

.
Test Results
.
As part of the ‘Technical Indicator Fight for Supremacy‘ We have tested/will test the Vertical Horizontal Filter as a component in several technical indicators:
- Vertical Horizontal Filter Variable Moving Average (VHF-VMA)
- Vertical Horizontal Filter Weighted Moving Average (VHF-WMA)
- Vertical Horizontal Filter Adaptive Moving Average (VHF-AMA)
- Relative Volatility Index Log Normal Adaptive Moving Average (RV-LAMA)
We will also be testing it for buy and sell signals in conjunction with trending and mean revision indicators.
.