The Golden Cross typically referrers to the crossing of the 50 and 200 Day Simple Moving Averages. When the shorter term average moves above the longer term average this is seen by many as the beginning of a sustained bullish period and vise versa. It is not wise however to risk your money in the market on the assumption that such a theory is true.
One has to ask, which is better, a SMA Golden Cross or an EMA Golden Cross? Are the settings of 50 & 200 really the best? What is the profile of the trades that this strategy generates as far as duration, probability of profit, draw downs etc. In order to answer these questions we applied some brute mathematical force and tested 1750 different combinations through 300 years of data across 16 different global markets~. We have done the hard work and you get the benefits for free… aren’t you lucky.
Michael Stokes over at MarketSci has also written a great series on Trading The Golden Cross.
Download A FREE Spreadsheet With Data, Charts
And Results For all 1750 Moving Average Crossovers Tested
.
Golden Cross, Moving Average Crossover – Test Results:
.
- Our Testing Strategy Explained
- Simple vs Exponential Moving Average Crossover
- Daily vs Weekly Moving Average Golden Cross
- Golden Cross – Refined Test Sets
- The True Golden Cross
.
Our Testing Strategy Explained
There are endless combinations of moving averages that we could test in search of the best. To cast our testing range wide but intelligently we have used progressions of a ratio; slow/fast MA:
Fast Moving Averages (FC) = 5, 10, 15, 20, 25, 30, 35, 40, 45, 50
Slow Moving Averages (SC) = 1.2 * FC, 1.4 * FC, 1.6 * FC, …….. 5.6 * FC, 5.8 * FC, 6 * FC
So each of the ten FC settings were tested against twenty five SC settings based on a multiple of the FC. e.g The traditional Golden Cross with a SC of 50 and a FC of 200 has a multiple of 4 (because 50 * 4 = 200). The tests against a FC of 50 had a multiple as low as 1.2… (50 * 1.2 = 60) and as high as 6… (50 * 6 = 300).
Hopefully by using this tactic we can identify the multiples or ratios that deserve more targeted testing.
.
Simple vs Exponential Moving Average Crossover
In our original MA test; Moving Averages – Simple vs. Exponential we revealed that the Exponential Moving Average (EMA) was superior to the Simple Moving Average (SMA). If the same proves to be true with the ‘Golden Moving Average Crossover’ then this will further validate the EMA as being of higher-caliber than the SMA.

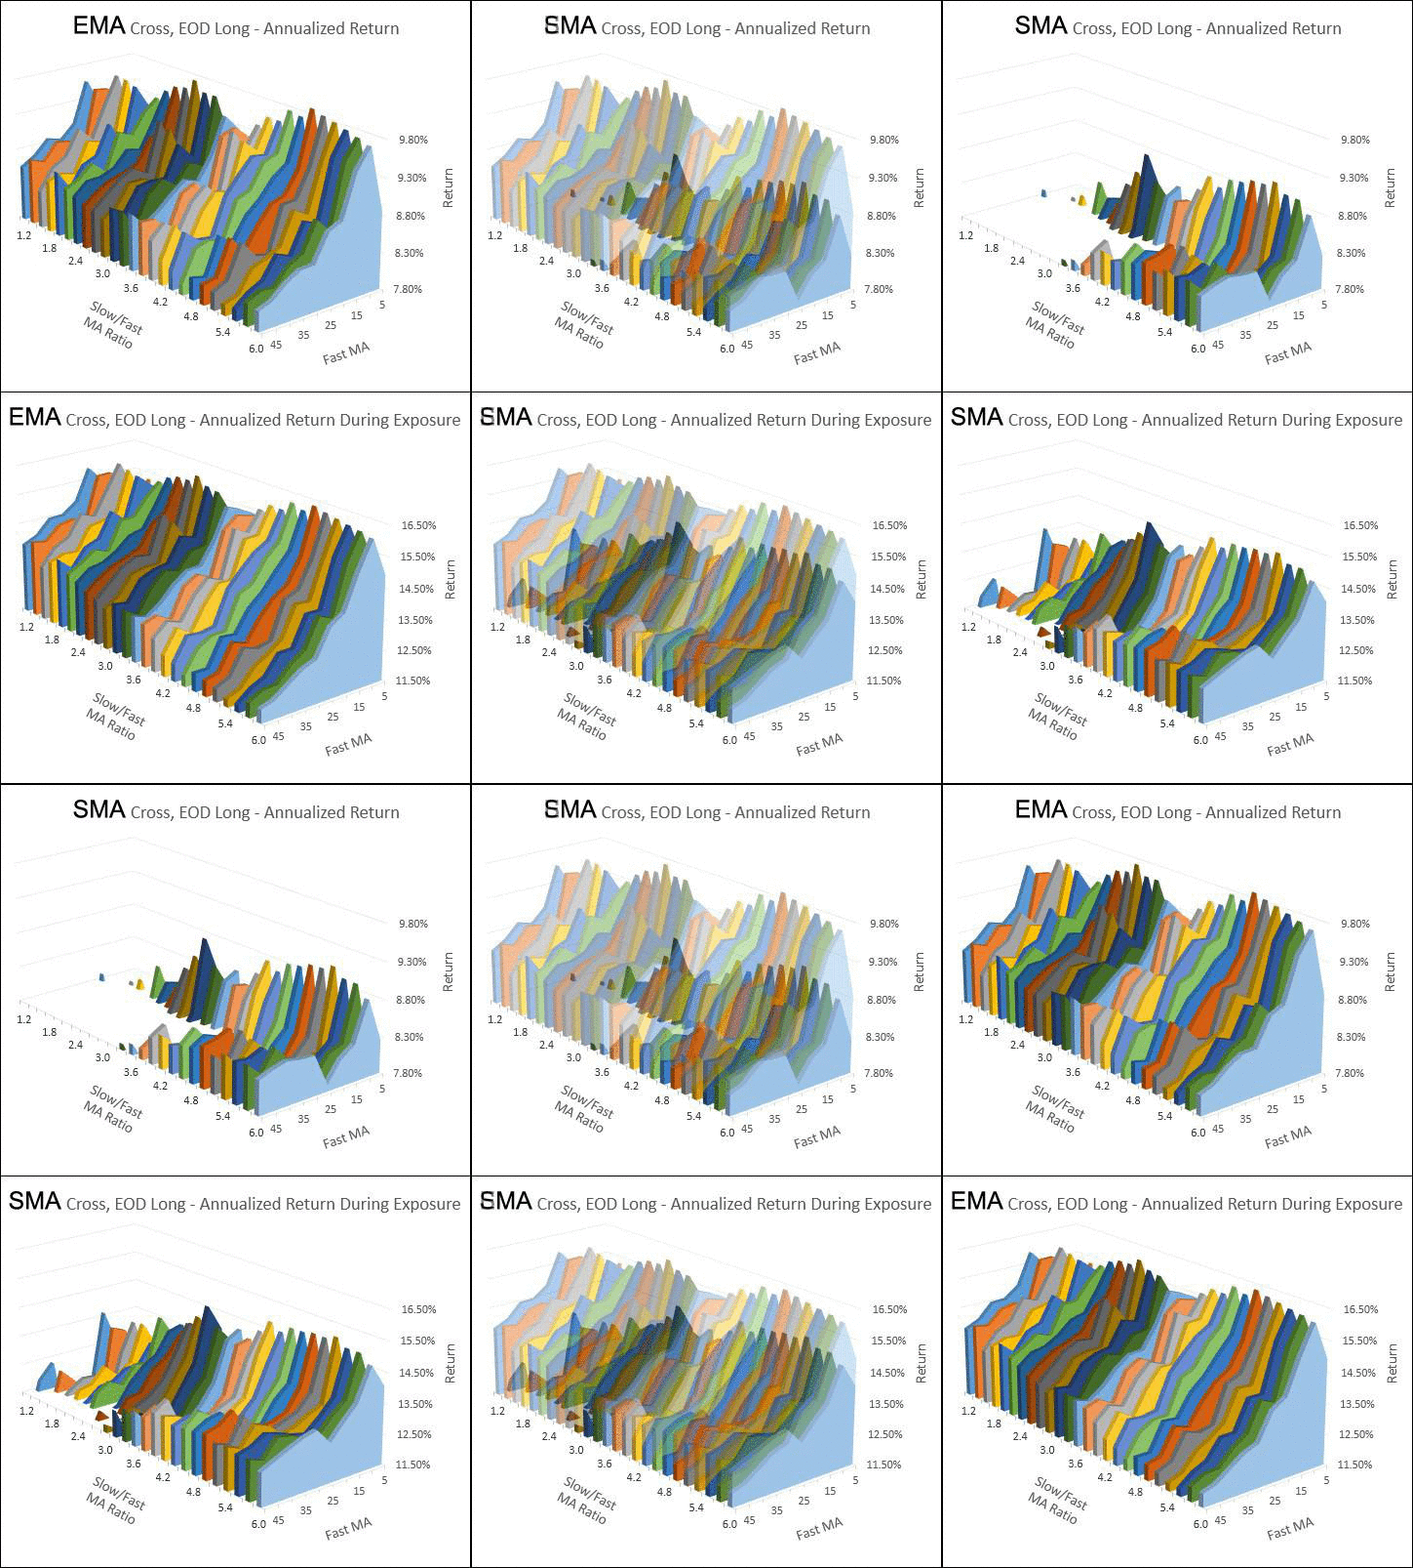
The chart above fades between the results from the EMA and the SMA crossover tests. As you can see the EMA outperforms the SMA by well over a percentage point on average. This unequivocally confirms that the EMA is superior to the SMA. Further more it should be noted that every single EMA combination tested (and most SMAs) outperformed the buy and hold annualized return of 6.32%^ during the test period (before allowing for transaction costs and slippage). But “technical analysis doesn’t work” they say.
.
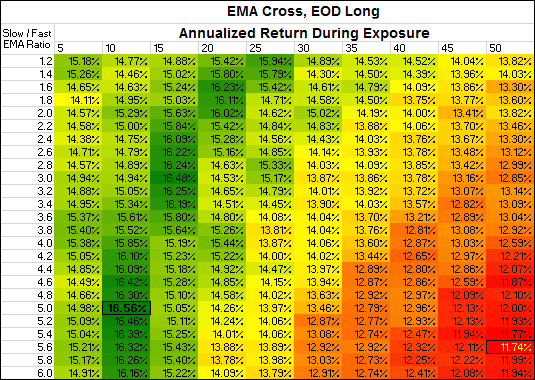
Below are the all the individual Annualized returns from the EMA chart above:

The best returns came from an fast EMA of 10 days with a slow EMA of 50 (ratio of 5 because 10 * 5 = 50). Based on these results we will run more refined tests on fast moving averages in the range of 8 – 17 and slow moving averages 20 – 56.
.
Daily vs Weekly Moving Average Golden Cross
What about Weekly data you ask? We didn’t test with Weekly data but we did test using End Of Week (EOW) signals on Daily data (previous tests on the EMA revealed that the two produce almost identical results). When we used EOW signals the returns dropped by 0.5% on average while the trade duration increased by just 10 days and the probability of profit increased by only 2%. In other words; you are better to use daily data and EOD signals on a Moving Average Crossover Strategy.
.
Golden Cross – Refined Test Sets
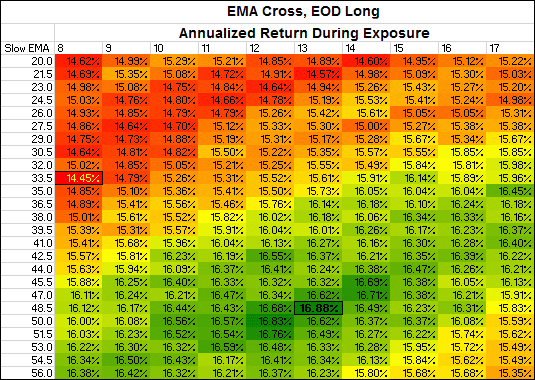
After getting a better idea of the ‘sweet’ spot from our first round of testing, we refined our range and instead of continuing with ratios of fast and slow EMA crossovers, we progressed in a liner fashion. So what is the “True Golden Cross” that proved the best returns during our tests?

There is a zone of dark green on the grid above but the very best from our tests, the True Golden Cross has a slow EMA of 48.5 and a fast EMA of 13. Reality is very different from the 50/200 SMA Golden Cross that someone made up once upon a time and that is why we must test everything.
.
The True Golden Cross
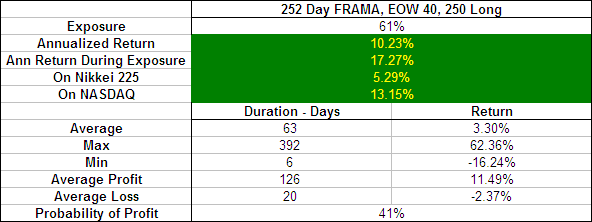
The profile of the trades produced by the true Golden Cross have many very desirable features; a significant average trade duration (94 days), a high probability of profit (45%) and solid returns across the board (even on the difficult, bear savaged Nikkei 225). While it does not produce returns any where near as good as the best FRAMA, it certainly out performs the traditional Golden Cross of 50 / 200. Plus with the long trade duration, it may be more desirable than the slower FRAMA for use as a long term indicator as one part of a complete trading system:

.
Golden Cross Conclusion
Moving average crossovers have proven themselves to be a powerful and effective form of technical analysis, however the so called “Golden Cross” of the 50 and 200 day SMA is far from the best. Our testing revealed that the EMA produces better results than the SMA and the best settings are that of a 13 / 48.5 EMA Crossover. The long duration of the trades produced, ability to sidestep bear markets and the high probability of profit make it worth testing as a major component in a complete trading system.
The moving average crossover is a component of the popular Moving Average Convergence Divergence (MACD), see the completed test results here.
More in this series:
We have conducted and continue to conduct extensive tests on a variety of technical indicators. See how they perform and which reveal themselves as the best in the Technical Indicator Fight for Supremacy.
- ~ An entry signal to go long for each crossover tested was generated when the faster moving average of each pair closed above the slower moving average (the opposite closed the position or triggered a signal to go short. No interest was earned while in cash and no allowance has been made for transaction costs or slippage. Trades were tested using End Of Day (EOD) and End Of Week (EOW) signals for Daily data. Eg. Daily data with an EOW signal means that only the signals at the end of each week were taken.
- ^ This was the average annualized return of the 16 markets during the testing period. The data used for these tests is included in the results spreadsheet and more details about our methodology can be found here.
