Linear Regression Indicator (LRI) & Time Series Forecast (TSF)

Linear Regression is a statistical tool used to predict future values from past values.  By using the least squares method, a straight line can be plotted that minimizes the distance between the resulting line and the data set in order to reveal a trend.

The Linear Regression Indicator (LRI) plots the end value of a Linear Regression Line at each data point.  A variation on the same idea is the Time Series forecast (TSF) which is found by adding the Linear Regression Slope to the Linear Regression Line.  The TSF basically projects the LRI forward one period.  The TSF is also sometimes referred to as a Moving Linear Regression or Regression Oscillator.

By calculating these two indicators on a moving basis the result looks similar to that of a moving average and can be used in the same way.

.

Calculating a Linear Regression Line

.

Linear Regression Line = a + bx

Where:

a = (Σy – bΣx) / n

b = (nΣ(xy) – (Σx) (Σy)) / (nΣx² – (Σx)²)

b = Linear Regression Slope.

x = The current time period.

y = The data series (Usually the close price).

n = Number of periods.

.

Linear Regression Indicator & Time Series Forecast Excel File

.

Calculating these indicators by hand is a pain in the ass so we have build an Excel spreadsheet containing both the Linear Regression Indicator and Time Series forecast that you can download for free.  Find it at the following link near the bottom of the page under Downloads – Technical Indicators: Linear Regression Indicator (LRI) & Time Series Forecast (TSF).  Please let us know if you find it useful.

.

Linear Regression Indicator, Time Series Forecast and a Simple Moving Average

.

Linear Regression Indicator, Time Series Forecast and SMA.

Test Results

.

We tested the Linear Regression Indicator and Time Series forecast through 300 years of data across 16 global markets to reveal which is the best and if either of them are worth using as trading tool for data smoothing – see the results.

.

.

Wilder’s Smoothing was developed buy J. Welles Wilder, Jr. and he used it as a component in several of his other indicators including the RSI which is one of the most popular technical indicators of all time.

ETF HQ Report – One Major Development

November 01, 2010 – 06:20 am EDT

The market was flat over the last week but there was one major development…  SMH violently broke through resistance and finished the week 3.65% higher.  This took me by real surprise but is a very bullish sign and does now mean that we can get away with seeing some profit taking without killing the bull.  Over the short term however profit taking is becoming more and more likely.

****Thanks to all those who referred people to this newsletter over the last week. The more readers we have the more services we can provide you.

.

ETF % Change Comparison

.

ETF % Change Comparison

SMH is now over 21% off the low it set 59 days ago which is twice the move of DIA.  Now the transports are less than 1% from making a new high, if they can do this then it would be a very bullish sign.

Learn moreETF % Change Comparison

.

1

.

A Look at the Charts

.

SPY

Can the grind higher continue?  Momentum is slowing but prices are yet to take a step back.

.

QQQQ

Well out in new high territory and with SMH playing catch up; QQQQ is gaining credibility for its longer term prospects.

.

SMH

Again I underestimated this market but the recent action from SMH is a very bullish sign.

.

IWM

Volume on IWM is particularly weak and further suggests short term weakness.

.

IYT

If the Transports breakout here then expect yet another leg to this rally.

.

1

.

OM3 Weekly Indicator

.

OM3 Indicator

The OM3 Indicator has issued its first ‘Bear Alerts’ in 7 weeks further indicating that the market momentum is slowing but all buy signals remain active.

Learn moreThe OM3 Indicator

.

1

.

TransDow & NasDow

.

TransDow & NasDow

This is a positive development; the NasDow indicates that the NASDAQ has taken dominance over the Dow and opened a new position in the NASDAQ on Friday.  The TransDow continues to maintain a position in the Transportation index and is showing a small profit.

.

What the TransDow Readings tell us:

The TransDow measures dominance between the DJ Transportation Index (DJTI) and the Dow Jones Industrial Average (DJIA). In a strong market the more economically sensitive Transportation Index should be dominant over the DJIA.

Historically the DJTI has been dominant over the Dow 45% of the time. The annualized rate of return from the DJTI during this period was 18.47% with the biggest loss for one trade sitting at -13.27%. The annualized return from the DJIA during the periods it was dominant over the DJTI was just 4.06% and the biggest loss for one trade was -16.13%. A 4% stop-loss is applied to all trades adjusting positions only at the end of the week.

What the NasDow Readings tell us:

The NasDow measures dominance between the NASDAQ and the DJIA. Using the same theory behind the Trans Dow; in a strong market the more economically sensitive NASDAQ should be dominant over the DJIA.

Historically the NASDAQ has been dominant over the DJIA 44% of the time. Taking only the trades when the NASDAQ is above its 40 week moving average the annualized rate of return was 25.47% with the biggest loss for one trade sitting at –8.59%. The annualized rate on the DJIA during the periods it was dominant over the NASDAQ is just 8.88% and the biggest loss for one trade was –12.28%. A 8% stop-loss is applied to all trades adjusting positions only at the end of the week.

.

1

.

LTMF 80 & Liquid Q

.

LTMF 80 & Liquid Q

LTMF 80 remains in QQQQ and is showing a tasty little profit of 8.73% after 42 days while Liquid Q has just opened a new position in QQQQ.

.

Historical Stats:

.

LTMF 80 & Liquid Q Stats

.

How The LTMF 80 Works

LTMF stands for Long Term Market Forecaster. It reads volume flows relative to price action and looks for out performance of volume measured on a percentage basis over the prior 12 months. During a sustained rally the readings will reach high levels (near 100%) making it imposable for the volume reading to always outperform price so any reading above 80% will maintain the buy signal. This system has outperformed the market over the last 10 years but performance has been damaged by some nasty losses. It only produces buy signals and only for QQQQ.

How Liquid Q Works

Liquid Q completely ignores price action and instead measures the relative flow of money between a selection of economically sensitive and comparatively stable ares of the market. It looks for times when the smart money is confident and and can be seen by through volume investing heavily is more risky areas due to an expectation of expansion. This system has outperformed the market over the last 10 years and remained in cash through most of the major declines. It only produces buy signals and only for QQQQ. We will provide more performance details on the web site for these systems soon.

.

1

.

Summary

This market is far from perfect and should be treated with skepticism.  We have been looking for excuses to sell but they never really came… the market has just kept grinding higher.  Now with SMH breaking out and fresh buy signals from some of our models the longer term prospects are looking much better.  Over the short term however we are due for a test of support.

.

Any disputes, questions, queries, comments or theories are most welcome in the comments section below.

.

Happy HalloweenCreepy Me

Derry

And the Team @ ETF HQ

“Equipping you to win on Wall St so that you can reach your financial goals.”

.

P.S Like ETFHQ on Facebook – HERE

.

1

.

Quote of the Day:

“Watch your thoughts, for they become words.  Choose your words, for they become actions.  Understand your actions, for they become habits.  Study your habits, for they will become your character.  Develop your character, for it becomes your destiny!” – Unknown

ETF HQ – Quiet on the Range

October 25, 2010 – 07:05 am EDT

It was all quiet on the range over the last week with no major moves in either direction.  Because there has been such a lack of volume behind the second half of this rally, momentum is particularly important.  When the momentum is gone there will be little to hold this market up so any loss of support is likely to escalate into more sustained selling.  Indications are that momentum has run out but we are yet to see support levels being broken.  Lets take a closer look…

****Thanks to all those who referred people to this newsletter over the last week. The more readers we have the more services we can provide you.

.

ETF % Change Comparison

.

ETF % Change Comparison

All the influential ETFs managed to finish the week higher but not by much.  If we see some profit taking over the coming week I will be looking to IWM and SMH in particular to get a gauge of how real it is.

Learn moreETF % Change Comparison

.

1

.

A Look at the Charts

.

SPY

Signs of a slow in momentum on the back of poor volume flows make higher prices difficult.

.

QQQQ

If the RSI on QQQQ turns bearish then this will be a good excuse to take profits as volume flows remain weak.

.

SMH

If SMH can close above $29 then I will be very surprised but this would very positive.

.

IWM

The volume trend has turned bearish along with the RSI indicating that higher prices are most unlikely.

.

IYT

If the transports can close at a new high then this would be a very positive sign for the broad market and would stand as a good reason to keep holding onto your longs.

.

1

.

OM3 Weekly Indicator

.

OM3 Indicator

The OM3 indicator remains positive across the board.

Learn moreThe OM3 Indicator

.

1

TransDow & NasDow

.

TransDow & NasDow

The TransDow continues to hold a position (with a small profit) in the Transportation Index as it remains dominant over the Dow.  The NasDow indicates that the Dow is dominant over the NASDAQ which is historically an unproductive time so it remains in cash.

.

What the TransDow Readings tell us:

The TransDow measures dominance between the DJ Transportation Index (DJTI) and the Dow Jones Industrial Average (DJIA). In a strong market the more economically sensitive Transportation Index should be dominant over the DJIA.

Historically the DJTI has been dominant over the Dow 45% of the time. The annualized rate of return from the DJTI during this period was 18.47% with the biggest loss for one trade sitting at -13.27%. The annualized return from the DJIA during the periods it was dominant over the DJTI was just 4.06% and the biggest loss for one trade was -16.13%. A 4% stop-loss is applied to all trades adjusting positions only at the end of the week.

What the NasDow Readings tell us:

The NasDow measures dominance between the NASDAQ and the DJIA. Using the same theory behind the Trans Dow; in a strong market the more economically sensitive NASDAQ should be dominant over the DJIA.

Historically the NASDAQ has been dominant over the DJIA 44% of the time. Taking only the trades when the NASDAQ is above its 40 week moving average the annualized rate of return was 25.47% with the biggest loss for one trade sitting at –8.59%. The annualized rate on the DJIA during the periods it was dominant over the NASDAQ is just 8.88% and the biggest loss for one trade was –12.28%. A 8% stop-loss is applied to all trades adjusting positions only at the end of the week.

.

1

.

LTMF 80 & Liquid Q

.

LTMF 80 & Liquid Q

LTMF 80 remains in QQQQ and is showing a tasty little profit while Liquid Q remains in cash.

.

Historical Stats:

.

LTMF 80 & Liquid Q Stats

.

How The LTMF 80 Works

LTMF stands for Long Term Market Forecaster. It reads volume flows relative to price action and looks for out performance of volume measured on a percentage basis over the prior 12 months. During a sustained rally the readings will reach high levels (near 100%) making it imposable for the volume reading to always outperform price so any reading above 80% will maintain the buy signal. This system has outperformed the market over the last 10 years but performance has been damaged by some nasty losses. It only produces buy signals and only for QQQQ.

How Liquid Q Works

Liquid Q completely ignores price action and instead measures the relative flow of money between a selection of economically sensitive and comparatively stable ares of the market. It looks for times when the smart money is confident and and can be seen by through volume investing heavily is more risky areas due to an expectation of expansion. This system has outperformed the market over the last 10 years and remained in cash through most of the major declines. It only produces buy signals and only for QQQQ. We will provide more performance details on the web site for these systems soon.

.

1

.

Summary

The Transports are knocking on the door of new highs and SMH on the door of a higher high.  The market is unlikely to have the momentum to break through these resistance levels but if it can then profit taking can occur without killing the bull.  If the profit taking comes before these levels are broken then due to the lack of volume the declines could be sharp.

.

Any disputes, questions, queries, comments or theories are most welcome in the comments section below.

.

Cheers

Derry

And the Team @ ETF HQ

“Equipping you to win on Wall St so that you can reach your financial goals.”

.

P.S Like ETFHQ on Facebook – HERE

.

1

.

Quote of the Day:

“It doesn’t matter if people are interested.  It’s about you taking your stuff and shouting out into the void.” – Jadelr and Cristina Cordova

Simple Moving Average (SMA)

The Simple Moving Average or SMA is probably the most commonly used technical indicator of all.  It can be calculated by taking the average of a data series (usually the close price) over a set number of periods.  As each period progresses the last value is dropped out of the calculation and the latest one takes its place; hence the ‘Moving’ characteristic.

Financial data is notorious for being full of noise.  Smoothing methods like averages help to filter out some of that noise so that a clearer picture of what is really going on can be revealed.  Test results show however the Simple Moving Average is certainly not the most effective smoothing method available.  Why then do we use the SMA in the weekly ETF HQ Report?

Some Simple Moving Averages such as the 50, 100 and 200 day SMA are so widely followed that they regularly become important support and resistance levels.  There is no reason why this should happen other than the fact that they have become a self fulfilling prophecy.  If enough people think that a level is important then it becomes important:

.

200 Day Simple Moving Average as Support.

Above is an example the 200 day SMA acting as support and being seen as a buying opportunity for over a year.  With so many points of inflection on this average the eventual break was viewed by traders as a significant technical failure and a flood of selling ensued.

For those of you who use Excel in your trading I have built a spreadsheet for you that contains a simple moving average.  You are probably wondering why you would want to download such a simple indicator but this one is useful because it will automatically adjust to the length that you specify.  We find this a useful feature and hopefully you will as well.  Get the file at the following link near the bottom of the page under Downloads – Technical Indicators: Simple Moving Average (SMA).  Please let us know if you find it useful.

.

Moving Average Test Results

.

Have you ever wondered which is better; a simple or exponential moving average?  Well we tested both along with a double exponential moving average through 300 years of data across 16 global markets to reveal the answer.  Here are the results – Simple vs. Exponential Moving Average

.

Sine Weighted Moving Average (SW-MA)

The Sine Weighted Moving Average is being tested along with many other indicators in the ‘Technical Indicator – Fight for Supremacy‘.  It is not an indicator that many people will be familiar with so I will briefly cover how it is calculated and have also built the Sine Weighted Moving Average into an Excel Spreadsheet for free download.

A Sine wave is a smooth, repetitive oscillation that shifts between a high of y and a low of -y.  A SW-MA takes its weighting from the first half of a Sine wave cycle so the largest weighting is given to the data in the middle.  The result is very similar to the Triangular Moving Average (Tri-MA) but much more difficult to calculate.  Below you can see how the weighting is applied to a 50 period SW-MA, EMA and SMA:

.

Weight - SW-MA vs EMA vs SMA

.

How To Calculate a Sine Weighted Moving Average

.

To calculate the Sine Weighted Moving Average multiply the sine value for each period by the close price for that period, add it all up and divide the result by the sum of the sine weights.  As a formula it looks like this:

.

Sine Weighted Moving Average Formula.

Here is an example of a 3 period Sine Weighted Moving Average:

.

Calculating a Sine Weighted Moving Average

.

Sine Weighted Moving Average Excel File

.

An Excel Spreadsheet containing a Sine Weighted Moving Average is available for FREE download.  It contains the ‘basic’ version you can see above and a ‘fancy’ one that will automatically adjust to the length you specify.  Find it at the following link near the bottom of the page under Downloads – Technical Indicators: Sine Weighted Moving Average (SW-MA).  Please let us know if you find it useful.

.

Sine Weighted Moving Average and a Simple Moving Average

.

Sine Weighted Moving Average and a Simple MA

.

Test Results

.

We tested several different types of Weighted Moving Averages including the SW-MA through 300 years of data across 16 global markets to reveal which is the best and if any of them are worthy of use as a trading tool.  See the results – Weighted Moving Averages Put To The Test

.

.

Wilder’s Smoothing was developed buy J. Welles Wilder, Jr. and he used it as a component in several of his other indicators including the RSI which is one of the most popular technical indicators of all time.

Triangular Moving Average (TriW-MA)

The Triangular Weighted Moving Average (TriW-MA) is included in the ‘Technical Indicator – Fight for Supremacy‘ so before we test it here is some information on how it is calculated.  If you would like to use the Triangular Moving Average in Excel then you can download a free spreadsheet HERE.

The TriW-MA gets it name from the way it applies the weight to data; because the emphasis is on the values in the middle, the weighting takes the shape of a triangle.  Below you can see how the weighting is applied to a 50 period TriW-MA, EMA and SMA:

.

Weight - TriW-MA vs EMA vs SMA

.

How To Calculate a Triangular Weighted Moving Average

.

To calculate a Triangular Weighted Moving Average multiply each close price by the weight for that period, add it all up and divide the result by the sum of the weights.  The weighting multiplier starts at 1 and increases by 1 until it peaks half way through the set before decreasing symmetrically back down to finish at 1 again.

Here is an example of a 3 period Triangular Weighted Moving Average:

.

Calculating a Triangular Weighted Moving Average

.

The same result can be achieved by using a double smoothed moving average AKA the Triangular Simple Moving Average.

.

Triangular Weighted Moving Average Excel File

.

An Excel Spreadsheet containing a Triangular Weighted Moving Average is available for FREE download.  It contains the ‘basic’ version you can see above and a ‘fancy’ one that will automatically adjust to the length you specify.  Find it at the following link near the bottom of the page under Downloads – Technical Indicators: Triangular Weighted Moving Average (TriW-MA).  Please let us know if you find it useful.

.

Triangular Moving Average and a Simple Moving Average

.

Triangular Weighted Moving Average and a Simple MA

.

Test Results

.

We tested several different types of Weighted Moving Averages including the TriW-MA through 300 years of data across 16 global markets to reveal which is the best and if any of them are worth using in your trading systems.  See the results – Weighted Moving Averages Put To The Test

Weighted Moving Averages Put To The Test

A Weighted Moving Average smooths data by setting a separate but specific weighting for each data set over the length of its smoothing period.  In this round of testing we will look at the standard Weighted Moving Average (W-MA), the Triangular Weighted Moving Average (TriW-MA) and the Sine Weighted Moving Average (SW-MA) in order to reveal which is the best and if any of them are worth including in your trading tool box.

To evaluate these averages we tested Long and Short trades using Daily and Weekly data, taking End Of Day (EOD) and End Of Week (EOW) signals with Moving Average lengths varying from from 5 – 300 days or 60 weeks.~ These tests were carried out over a total of 300 years of data across 16 different global indexes (details here).

.

Weighted Moving Averages – Test Results:

.

Weighted Moving Average – Test Conclusion

.

Weighted Moving Average - Long and Short Annualized Return

.

Above you can see how the annualized return changes with the length of each Daily, EOD Moving Average for the Long and the Short side of the market.  The relative performance of each MA was similar when going Long or Short but the returns on the Short side were much lower.

There is little difference in performance between the TriW-MA and the SW-MA while the W-MA was clearly superior.  The W-MA performed particularly well with a setting of 35 days or 110 days, peaking with a annualized return of over 10% on these settings.  As the smoothing period is extended beyond 110 days the returns gradually diminished.

Return to Top

.

Weighted Moving Average - Long and Short Annualized Return During Exposure

.

Above you can see the performance of each average during the time that it was exposed to the market.  Across the board the efficiency of each average decreased as the length of each average is was increased.  The W-MA again proved the most effective.

Return to Top

.

Best Weighted Moving Average – Long

.

We tested 357 averages on the Long side but rather than simply selecting the one with the greatest returns over the test period we looked for the following criteria:

  • Annualized Return > 9%
  • Average Trade Duration > 29 Days
  • Annualized Return During Exposure > 15%
  • Annualized Return on Nikkei 225 > 3%
  • Annualized Return on NASDAQ > 12.5%

8/357 Averages made the final cut (see spreadsheet) but we selected the 90 Day Weighted Moving Average with End of Week Signals as the ultimate winner:
.

90 Day W-MA, EOW Long

.
Above you can see how the 90 Day W-MA, EOW Long performed during the test period compared to the 75 Day EMA, EOW Long which was selected as the most effective Exponential Moving Average in a previous test.  The Weighted MA produced very similar results to the EMA but didn’t offer any benefits.

Return to Top

.

Weighted Moving Average – Test Conclusion

.

The Triangular and Sine Weighted Moving Averages proved to be inferior to the W-MA while the standard Weighted Moving Average did produce reasonable returns.  Those returns however, were similar (if slightly inferior) to those of an Exponential Moving Average while not offering any notable benefits.  Therefore it can be concluded that none of the Weighted Moving Averages we tested are worth perusing further.

Return to Top

.

  • ~ An entry signal to go long (or exit signal to cover a short) for each average tested was generated with a close above that average and an exit signal (or entry signal to go short) was generated on each close below that moving average.  No interest was earned while in cash and no allowance has been made for transaction costs or slippage.  Trades were tested using End Of Day (EOD) and End Of Week (EOW) signals for Daily data and EOW signals only for Weekly data.  Eg. Daily data with an EOW signal would require the Week to finish above a Daily Moving Average to open a long or close a short and vice versa.
    .
  • – The average annualized return of the 16 markets during the testing period was 6.32%.  The data used for these tests is included in the results spreadsheet and more details about our methodology can be found here.
  • ETF HQ Report – Looks Good, Smells Rotten

    October 18, 2010 – 07:00 am EDT

    The market had another great week and QQQQ actually moved to a new high for the year.  It is always good to see the NASDAQ 100 ETF leading the market higher so what is the problem?  There continues to be a distinct lack of volume behind the second leg of this rally and SMH lagged behind over the last week.  These signs are not encouraging but lets take a closer look…

    ****Thanks to all those who referred people to this newsletter over the last week. The more readers we have the more services we can provide you.

    .

    ETF % Change Comparison

    .

    ETF % Change Comparison

    As you can see, SMH was only up 0.42% over the last week despite QQQQ leaping ahead 3.50%.  This would not be so concerning were it not for the lack of volume.

    Learn moreETF % Change Comparison

    .

    1

    .

    A Look at the Charts

    .

    SPY

    Now is a time to hold and look for excuses to sell.  Volume says that this rally is simply unsustainable.

    .

    QQQQ

    QQQQ’s new high, despite looking impressive lacks volume and the backing of the semiconductors.

    .

    SMH

    If SMH can close above $29 then I will be very surprised.  A close below $28 will be a warning to book profits.

    .

    IWM

    No reasons to jump out of IWM at this point but it wont take much for volume flows to turn bearish.

    .

    IYT

    IYT has the best volume flows of the influential ETFs.  If it can break through to new highs then this would be a very positive sign.

    .

    1

    .

    OM3 Weekly Indicator

    .

    OM3 Indicator

    There are no warning signs from the OM3 Indicator, ‘Strong Buy’ signals with ‘Bull Alerts’ persist across the board.

    Learn moreThe OM3 Indicator

    .

    1

    TransDow & NasDow

    .

    TransDow and NasDow

    The TransDow is showing a small profit after one week in the Transportation Index.  The NasDow indicates that the Dow has just become dominant over the NASDAQ; historically this has signaled increased risk in the market.

    .

    What the TransDow Readings tell us:

    The TransDow measures dominance between the DJ Transportation Index (DJTI) and the Dow Jones Industrial Average (DJIA). In a strong market the more economically sensitive Transportation Index should be dominant over the DJIA.

    Historically the DJTI has been dominant over the Dow 45% of the time. The annualized rate of return from the DJTI during this period was 18.47% with the biggest loss for one trade sitting at -13.27%. The annualized return from the DJIA during the periods it was dominant over the DJTI was just 4.06% and the biggest loss for one trade was -16.13%. A 4% stop-loss is applied to all trades adjusting positions only at the end of the week.

    What the NasDow Readings tell us:

    The NasDow measures dominance between the NASDAQ and the DJIA. Using the same theory behind the Trans Dow; in a strong market the more economically sensitive NASDAQ should be dominant over the DJIA.

    Historically the NASDAQ has been dominant over the DJIA 44% of the time. Taking only the trades when the NASDAQ is above its 40 week moving average the annualized rate of return was 25.47% with the biggest loss for one trade sitting at –8.59%. The annualized rate on the DJIA during the periods it was dominant over the NASDAQ is just 8.88% and the biggest loss for one trade was –12.28%. A 8% stop-loss is applied to all trades adjusting positions only at the end of the week.

    .

    1

    .

    LTMF 80 & Liquid Q

    .

    LTMF 80 and Liquid Q

    LTMF 80 is showing a tasty little profit on QQQQ after 28 days, lets hope that these profits will remain if we see a pull back.

    .

    Historical Stats:

    .

    LTMF 80 & Liquid Q Stats

    .

    How The LTMF 80 Works

    LTMF stands for Long Term Market Forecaster. It reads volume flows relative to price action and looks for out performance of volume measured on a percentage basis over the prior 12 months. During a sustained rally the readings will reach high levels (near 100%) making it imposable for the volume reading to always outperform price so any reading above 80% will maintain the buy signal. This system has outperformed the market over the last 10 years but performance has been damaged by some nasty losses. It only produces buy signals and only for QQQQ.

    How Liquid Q Works

    Liquid Q completely ignores price action and instead measures the relative flow of money between a selection of economically sensitive and comparatively stable ares of the market. It looks for times when the smart money is confident and and can be seen by through volume investing heavily is more risky areas due to an expectation of expansion. This system has outperformed the market over the last 10 years and remained in cash through most of the major declines. It only produces buy signals and only for QQQQ. We will provide more performance details on the web site for these systems soon.

    .

    1

    .

    Summary

    The rally over the last 7+ weeks has been impressive and the market has made some real ground higher.  At this time there are no solid reasons to sell but there are multiple warning signs that the current risk level is very high.  Most notably these risks are from a lack of volume almost across the board and more recently a failure by SMH at resistance.  Now is certainly not a time to be looking to open new bullish positions but it is a time to look for excuses to lock in profits.

    .

    Any disputes, questions, queries, comments or theories are most welcome in the comments section below.

    .

    Cheers

    Derry

    And the Team @ ETF HQ

    “Equipping you to win on Wall St so that you can reach your financial goals.”

    .

    P.S Like ETFHQ on Facebook – HERE

    .

    1

    .

    Quote of the Day:

    “The eyes of others are the eyes that ruin us.  If all but myself were blind, I should want neither fine clothes, fine houses, nor fine furniture.” – Benjamin Franklin

    ETF HQ Report – Enjoy It While It Lasts

    October 11, 2010 – 06:00 am EDT

    It was a week where everything that needed to occur, occurred and the bull remains alive.  In our last newsletter we spoke of how important it was for SMH to hold onto $27; due to the large volume divergence the market couldn’t afford to see any real profit taking.  Thankfully SMH never got the chance to test $27 and powered on to post some healthy gains.

    On a separate topic we have recently released some new research on the Fractal Adaptive Moving Average (FRAMA) that reveals this obscure indicator is more effective than any simple or exponential moving average.  Check it out and let me know what you think: FRAMA – Is It Effective?

    ****Thanks to all those who referred people to this newsletter over the last week.  The more readers we have the more services we can provide you.

    .

    ETF % Change Comparison

    .

    ETF % Change Comparison

    IYT, SMH and IWM were the leaders out of the influential ETFs over the last week.  This is fantastic news because we like to see these more economically sensitive ETFs leading the market.  As long as this pattern continues we must continue to take the bulls seriously.

    Learn moreETF % Change Comparison

    .

    1

    .

    A Look at the Charts

    .

    SPY

    Poor volume flows continue on SPY but prices also continue to rise.  If SMH and IWM falter then expect SPY to really suffer.

    .

    QQQQ

    QQQQ also shows a lack of conviction from its volume flows.  This makes the continued strength from SMH all the more important.

    .

    SMH

    A little more and volume flows on SMH will turn bullish which would be a major vote of confidence in the bulls.

    .

    IWM

    IWM keeps taking one step backwards and two steps forward but is moving in the right direction.  Volume needs to pickup though.

    .

    IYT

    Great to see OBV on the transports near a new high.  New highs from IYT backed by volume would be extremely bullish.

    .

    1

    .

    OM3 Weekly Indicator

    .

    OM3 Indicator

    ‘Strong Buy’ signals with ‘Bull Alerts’ persist across the board.

    Learn moreThe OM3 Indicator

    .

    1

    TransDow & NasDow

    .

    TransDow & NasDow

    The NasDow remains on No Signal while the TransDow opened a new position with the Transportation index on Friday.  This is positive as dominance from the Transports is an sign of market strength.

    .

    What the TransDow Readings tell us:

    The TransDow measures dominance between the DJ Transportation Index (DJTI) and the Dow Jones Industrial Average (DJIA). In a strong market the more economically sensitive Transportation Index should be dominant over the DJIA.

    Historically the DJTI has been dominant over the Dow 45% of the time. The annualized rate of return from the DJTI during this period was 18.47% with the biggest loss for one trade sitting at -13.27%. The annualized return from the DJIA during the periods it was dominant over the DJTI was just 4.06% and the biggest loss for one trade was -16.13%. A 4% stop-loss is applied to all trades adjusting positions only at the end of the week.

    What the NasDow Readings tell us:

    The NasDow measures dominance between the NASDAQ and the DJIA. Using the same theory behind the Trans Dow; in a strong market the more economically sensitive NASDAQ should be dominant over the DJIA.

    Historically the NASDAQ has been dominant over the DJIA 44% of the time. Taking only the trades when the NASDAQ is above its 40 week moving average the annualized rate of return was 25.47% with the biggest loss for one trade sitting at –8.59%. The annualized rate on the DJIA during the periods it was dominant over the NASDAQ is just 8.88% and the biggest loss for one trade was –12.28%. A 8% stop-loss is applied to all trades adjusting positions only at the end of the week.

    .

    1

    .

    LTMF 80 & Liquid Q

    .

    LTMF 80 & Liquid Q

    Liquid Q remains in cash while the LTMF 80 continues to hold a position in QQQQ that is showing a minor profit.

    .

    Historical Stats:

    .

    LTMF 80 & Liquid Q Stats

    .

    How The LTMF 80 Works

    LTMF stands for Long Term Market Forecaster. It reads volume flows relative to price action and looks for out performance of volume measured on a percentage basis over the prior 12 months. During a sustained rally the readings will reach high levels (near 100%) making it imposable for the volume reading to always outperform price so any reading above 80% will maintain the buy signal. This system has outperformed the market over the last 10 years but performance has been damaged by some nasty losses. It only produces buy signals and only for QQQQ.

    How Liquid Q Works

    Liquid Q completely ignores price action and instead measures the relative flow of money between a selection of economically sensitive and comparatively stable ares of the market. It looks for times when the smart money is confident and and can be seen by through volume investing heavily is more risky areas due to an expectation of expansion. This system has outperformed the market over the last 10 years and remained in cash through most of the major declines. It only produces buy signals and only for QQQQ. We will provide more performance details on the web site for these systems soon.

    .

    1

    .

    Summary

    Little has changed over the last week apart from the fact that the market is a bit higher.  SMH and IWM continue to fuel a market that lacks the backing of strong volume.  This is a risky situation that can also result in tidy profits.  Remain alert as things could turn bad in short order but until then, enjoy it while it lasts.

    .

    Any disputes, questions, queries, comments or theories are most welcome in the comments section below.

    .

    Cheers

    Derry

    And the Team @ ETF HQ

    “Equipping you to win on Wall St so that you can reach your financial goals.”

    .

    P.S Like ETFHQ on Facebook – HERE

    .

    1

    .

    Quote of the Day:

    “Knowing others is intelligence; knowing yourself is true wisdom.  Mastering others is strength; mastering yourself is true power.” – Tao Te Ching

    FRAMA – Is It Effective?

    The Fractal Adaptive Moving Average aka FRAMA is a particularly clever indicator.  It uses the Fractal Dimension of stock prices to dynamically adjust its smoothing period.  In this post we will reveal how the FRAMA performs and if it is worthy of being included in your trading arsenal.

    To fully understand how the FRAMA works please read this post before continuing.  You can also download a FREE spreadsheet containing a working FRAMA that will automatically adjust to the settings you specify.  Find it at the following link near the bottom of the page under Downloads – Technical Indicators: Fractal Adaptive Moving Average (FRAMA).  Please leave a comment and share this post if you find it useful.

    The ‘Modified FRAMA’ that we tested consists of more than one variable.  So before we can put it up against other Adaptive Moving Averages to compare their performance, we must first understand how the FRAMA behaves as its parameters are changed.  From this information we can identify the best settings and use those settings when performing the comparison with other Moving Average Types.

    Each FRAMA requires a setting be specified for the Fast Moving Average (FC), Slow Moving Average (SC) and the FRAMA period itself.  We tested trades going Long and Short, using Daily and Weekly data, taking End Of Day (EOD) and End Of Week (EOW) signals~ analyzing all combinations of:

    FC = 1, 4, 10, 20, 40, 60

    SC = 100, 150, 200, 250, 300

    FRAMA = 10, 20, 40, 80, 126, 252

    Part of the FRAMA calculation involves finding the slope of prices for the first half, second half and the entire length of the FRAMA period.  For this reason the FRAMA periods we tested were selected due to being even numbers and the fact that they correspond with the approximate number of trading days in standard calendar periods: 10 days = 2 weeks, 20 days = 1 month, 40 days = 2 months, 80 days = ⅓ year, 126 days = ½ year and there are 252 trading days in an average year.  A total of 920 different averages were tested and each one was run through 300 years of data across 16 different global indexes (details here).

    Download A FREE Spreadsheet With Raw Data For

    All 920 FRAMA Long and Short Test Results

    .

    FRAMA – Test Results:

    .

    Best FRAMA Parameters

    A Slower FRAMA

    FRAMA Testing – Conclusion

    .

    Daily vs Weekly Data – EOD vs EOW Signals

    .

    In our original MA test; Moving Averages – Simple vs. Exponential we revealed that once an EMA length was above 45 days, by using EOW signals instead of EOD signals you didn’t sacrifice returns but did benefit from a 50% jump in the probability of profit and double the average trade duration.  To see if this was also the case with the FRAMA we compared the best returns produced by each signal type:

    .
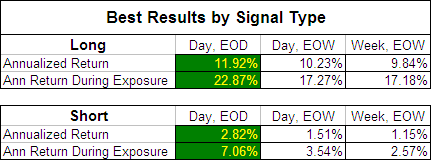
    FRAMA - Best Returns by Signal Type

    As you can see, for the FRAMA, Daily data with EOD signals produced by far the most profitable results and we will therefore focus on this data initially.  It is presented below on charts split by FRAMA period with the test results on the “y” axis, the Fast MA (FC) on the “x” axis and a separate series displayed for each Slow MA (SC).

    Return to Top

    .

    FRAMA Annualized Return – Day EOD Long

    .
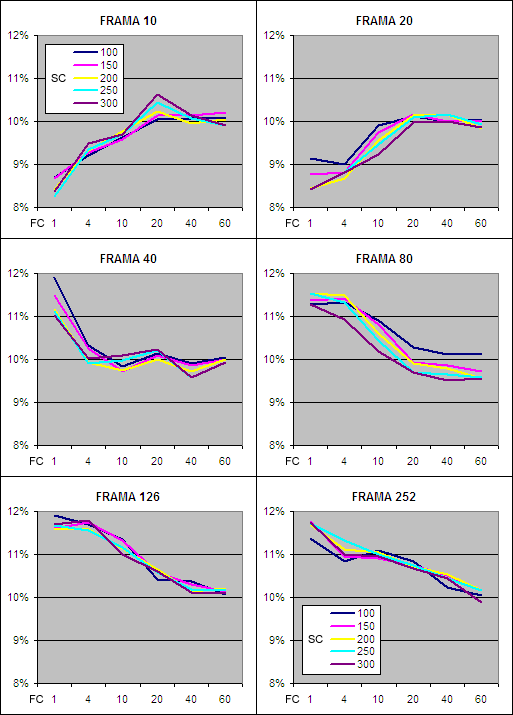
    FRAMA - Annualized Return, Long

    .

    The first impressive thing about the results above is that every single Daily EOD Long average tested outperformed the buy and hold annualized return of 6.32%^ during the test period (before allowing for transaction costs and slippage).  This is a strong vote of confidence for the FRAMA as an indicator.

    You will also notice that the data series on each chart are all bunched together revealing that similar results are achieved despite the “SC” period ranging from 100 to 300 days.  Changing the other parameters however makes a big difference and returns increase significantly once the FRAMA period is above 80 days.  This indicates that the Fractal Dimension is not as useful if measured over short periods.

    When the FRAMA period is short, returns increase as the “FC” period is extended.  This is due to the Fractal Dimension being very volatile if measured over short periods and a longer “FC” dampening that volatility.  Once the FRAMA period is 40 days or more the Fractal Dimension becomes less volatile and as a result, increasing the “FC” then causes returns to decline.

    Overall the best annualized returns on the Long side of the market came from a FRAMA period of 126 days which is equivalent to about six months in the market, while a “FC” of just 1 to 4 days proved to be most effective.  Assessing the results from the Short side of the market comes to the same conclusion although the returns were far lower: FRAMA Annualized Return – Short.

    Return to Top

    .

    FRAMA Annualized Return During Exposure – Day EOD Long

    .
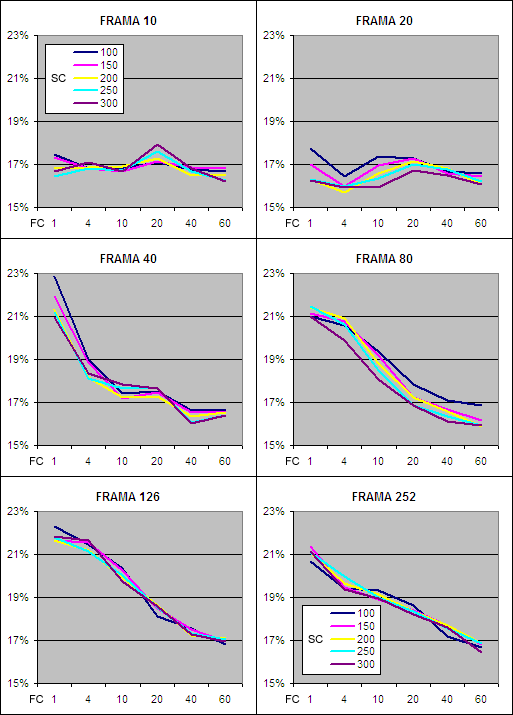
    FRAMA, Annualized Return During Exposure - Long.

    The above charts show how productive each different Daily FRAMA EOD Long was while exposed to the market.  Clearly the shorter FRAMA periods are far less productive and anything below 40 days is not worth bothering with.  The 126 day FRAMA again produced the best returns with the optimal “FC” being 1 – 4 days.  Returns for going short followed a similar pattern but as you would expect were far lower; FRAMA Annualized Return During Exposure – Short.

    Moving forward we will focus in on the characteristics of the 126 Day FRAMA because it consistently produced superior returns.

    Return to Top

    .

    FRAMA, EOD – Time in Market

    .

    FRAMA, Market Exposure - Long and Short.

    Because the 16 markets used advanced at an average annualized rate of 6.32%^ during the test period it doesn’t come as a surprise that the majority of the market exposure was to the long side.  By extending the “FC” it further increased the time exposed to the long side and reduced exposure on the short side.  If the test period had consisted of a prolonged bear market the exposure results would probably be reversed.

    Return to Top

    .

    FRAMA, EOD – Trade Duration

    .

    126 Day FRAMA, Average Trade Duration - Long & Short

    .

    By increasing the “FC” period it also extends the average trade duration.  Changing the “SC” makes little difference but as the “SC” is raised from 100 to 300 days the average trade duration does increase ever so slightly.

    Return to Top

    .

    FRAMA, EOD – Probability of Profit

    .

    126 Day FRAMA, Probability of Profit - Long & Short

    .

    As you would expect, the probability of profit is higher on the long side which again is mostly a function of the global markets rising during the test period.  However the key information revealed by the charts above is that the probability of profit decreases significantly as the “FC” is extended.  This is another indication that the optimal FRAMA requires a short “FC” period.

    Return to Top

    .

    The Best Daily EOD FRAMA Parameters

    .

    Our tests clearly show that a FRAMA period of 126 days will produce near optimal results.  While for the “SC” we have shown that any setting between 100 and 300 days will produce a similar outcome.  The “FC” period on the other hand must be short; 4 days or less.  John Ehlers’ original FRAMA had a “FC” of 1 and a “SC” of 198; this will produce fantastic results without the need for any modification.

    Because we prefer to trade as infrequently as possible we have selected a “FC” of 4 and a “SC” of 300 as the best parameters because these settings results in a longer average trade duration while still producing great returns on both the Long and Short side of the market:

    .

    FRAMA, EOD – Long

    .

    126 Day FRAMA, EOD 4, 300 Long

    .

    Above you can see how the 126 Day FRAMA with a “FC” of 4 and a “SC” of 300 has performed since 1991 compared to an equally weighted global average of the tested markets.  I have included the performance of the 75 Day EMA, EOW becuase it was the best performing exponential moving average from our original tests.

    This clearly illustrates that the Fractal Adaptive Moving Average is superior to a standard Exponential Moving Average.  The FRAMA is far more active however producing over 5 times as many trades and did suffer greater declines during the 2008 bear market.

    .

    FRAMA, EOD – Short

    .
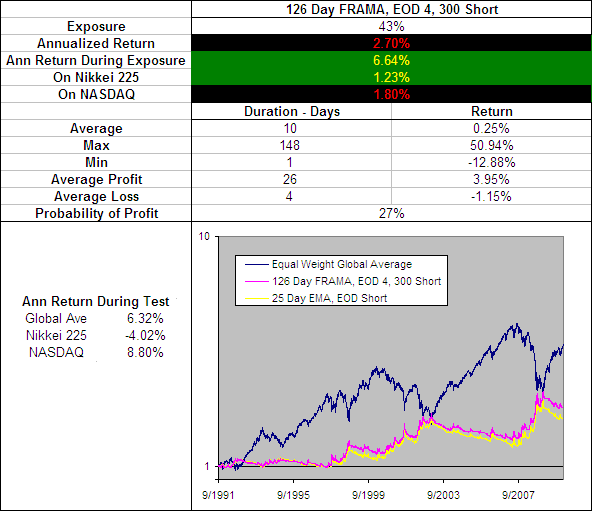
    126 Day FRAMA, EOD 4, 300 Short

    .

    On the Short side of the market the FRAMA further proves its effectiveness.  Without needing to change any parameters the 126 Day FRAMA, EOD 4, 300 remains a top performer.  When we ran our original tests on the EMA we found a faster average worked best for going short and that the 25 Day EMA was particularly effective.  But as you can see on the chart above the FRAMA outperforms again.

    What is particularly note worthy is that the annualized return during the 27% of the time that this FRAMA was short the market was 6.64% which is greater than the global average annualized return of 6.32%.

    .
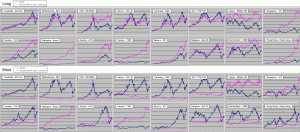
    126 Day FRAMA, EOD 4, 300 - Long and Short on Tested MarketsSee the results for the 126 Day FRAMA, EOD 4, 300
    Long and Short on each of the 16 markets tested.

    Return to Top

    .

    126 Day FRAMA, EOD 4, 300 – Smoothing Period Distribution

    .

    With a standard EMA the smoothing period is constant; if you have a 75 day EMA then the smoothing period is 75 days no matter what.  The FRAMA on the other hand is adaptive so the smoothing period is constantly changing.  But how is the smoothing distributed?  Does it follow a bell curve between the “FC” and “SC”, is it random or is it localized around a few values.  To reveal the answer we charted the percentage that each smoothing period occurred across the 300 years of test data:

    .

    126 Day FRAMA, EOD 4, 300 - Smoothing Period Distribution.

    The chart above came as quite a surprise.  It reveals that despite a “FC” to “SC” range of 4 to 300 days, 72% of the smoothing was within a 4 to 50 day range and the majority of it was only 5 to 8 days.  This explains why changing the “SC” has little impact and why changing the “FC” makes all the difference.  It also explains why the FRAMA does not perform well when using EOW signals, as an EMA must be over 45 days in duration before EOW signals can be used without sacrificing returns.

    Return to Top

    .

    A Slower FRAMA

    .
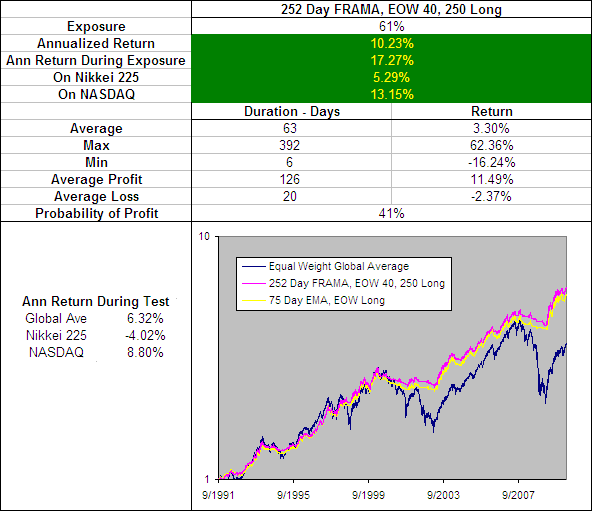
    We have identified that the FRAMA is a very effective indicator but the best parameters (126 Day FRAMA, EOD 4, 300 Long) result in a very quick average that in your tests had an typical trade duration of just 14 days.  We also know that the 75 Day EMA, EOW Long is an effective yet slower moving average and in our tests had a typical trade duration of 74 days.

    A good slow moving average can be a useful component in any trading system because it can be used to confirm the signals from other more active indicators.  So we looked through the FRAMA test results again in search a less active average that is a better alternative to the 75 Day EMA and this is what we found:

    .
    252 Day FRAMA, EOW 40, 250 Long.

    The 252 Day FRAMA, EOW 40, 250 Long produces some impressive results and does out perform the 75 Day EMA, EOW Long by a fraction.  However this fractional improvement is in almost every measure including the performance on the short side.  The only draw back is a slight decrease in the average trade duration from 74 days to 63 when long.  As a result the 252 Day FRAMA, EOW 40, 250 has knocked the 75 Day EMA, EOW out of the Technical Indicator Fight for Supremacy.

    .
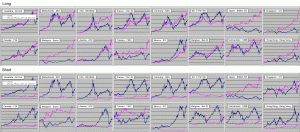
    252 Day FRAMA, EOW 40, 250 - Long and Short on Tested Markets
    See the results for the 252 Day FRAMA, EOW 40, 250
    Long and Short on each of the 16 markets tested.

    Return to Top

    .

    252 Day FRAMA, EOW 40, 250 – Smoothing Period Distribution

    .

    252 Day FRAMA, EOW 40, 250 - Smoothing Period Distribution.

    Return to Top

    .

    FRAMA Testing – Conclusion

    .

    The FRAMA is astoundingly effective as both a fast and a slow moving average and will outperform any SMA or EMA.  We selected a modified FRAMA with a “FC” of 4, a “SC” of 300 and a “FRAMA” period of 126 as being the most effective fast FRAMA although the settings for a standard FRAMA will also produce excellent results.  For a slower or longer term average the best results are likely to come from a “FC” of 40, a “SC” of 250 and a “FRAMA” period of 252.

    Robert Colby in his book ‘The Encyclopedia of Technical Market Indicators’ concluded, “Although the adaptive moving average is an interesting newer idea with considerable intellectual appeal, our preliminary tests fail to show any real practical advantage to this more complex trend smoothing method.”  Well Mr Colby, our research into the FRAMA is in direct contrast to your findings.

    It will be interesting to see if any of the other Adaptive Moving Averages can produce better returns.  We will post the results HERE as they become available.

    Well done John Ehlers you have created another exceptional indicator!

    .

    More in this series:

    We have conducted and continue to conduct extensive tests on a variety of technical indicators.  See how they perform and which reveal themselves as the best in the Technical Indicator Fight for Supremacy.


    Return to Top

    .


    • ~ An entry signal to go long (or exit signal to cover a short) for each average tested was generated with a close above that average and an exit signal (or entry signal to go short) was generated on each close below that moving average.  No interest was earned while in cash and no allowance has been made for transaction costs or slippage.  Trades were tested using End Of Day (EOD) and End Of Week (EOW) signals for Daily data and EOW signals for Weekly data. Eg. Daily data with an EOW signal would require the Week to finish above a Daily Moving Average to open a long or close a short while Daily data with EOD signals would require the Daily price to close above a Daily Moving Average to open a long or close a short and vice versa.
    • ^ This was the average annualized return of the 16 markets during the testing period. The data used for these tests is included in the results spreadsheet and more details about our methodology can be found here.