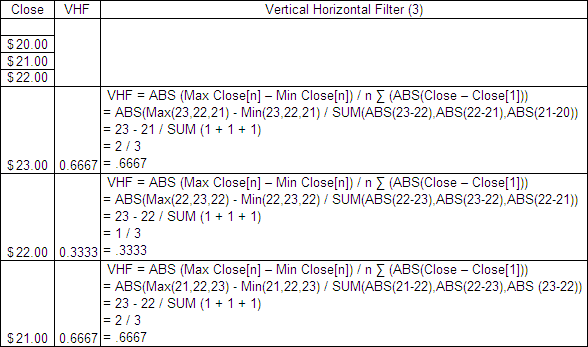
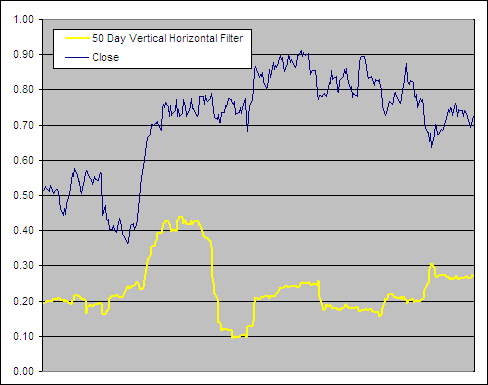
The Variable Moving Average (VMA) dynamically adjusts its own smoothing period to the changing market conditions based on a Volatility Index (VI). While any VI can be used, in this article we will look at how the VMA performs using a Vertical Horizontal Filter (VHF).
The VHF-VMA requires two user selected inputs: A Vertical Horizontal Filter Period and a VMA period. We tested trades going Long and Short using Daily data taking End Of Day (EOD) signals~ analyzing all combinations of:
VHF = 10, 20, 40, 80, 126, 252
VMA = 1 – 20
The VHF lengths were selected due to the fact that they correspond with the approximate number of trading days in standard calendar periods: 10 days = 2 weeks, 20 days = 1 month, 40 days = 2 months, 80 days = ⅓ year, 126 days = ½ year and there are 252 trading days in an average year.
The VMA periods were selected after preliminary tests showed that when combined with the different VHF lengths they resulted in median smoothing periods between 3 and 173 days; a range that should capture the best results based on what we know from previous research into moving averages.
A total of 160 different averages were tested and each one was run through 300 years of data across 16 different global indexes (details here).
Download A FREE Spreadsheet With Raw Data For
All 160 VHF-VMA Long and Short Test Results
.
VHF Variable Moving Average EOD Returns, Long:
.
.
As with previous VMA test, every single VHF-VMA using EOD signals managed to outperform the average buy and hold annualized return of 6.32%^ during the test period (before allowing for transaction costs and slippage).
The VHF periods of 126, 252 and 80 produced the best results when the VMA period was 10 or less while the highest returns came from a VHF period of 126 and a VMA period of 2. We have seen in every ‘intelegent’ moving average test so far the predominance of 126 and 252 as the volatility or trend strength indicator settings that produce the best returns.
.
Best EOD Vertical Horizontal Filter Variable Moving Average:
.
 .
.
I have included on the above chart the performance of the 126 Day FRAMA, EOD 4, 300 Long becuase so far this has been the best performing Moving Average. The 126 Day VHF-VMA, EOD 2, Long produced respectable results compared to the best that the FRAMA could produce but still under performed slightly. Plus there are several other things that go against the 126 Day VHF-VMA, EOD 2 such as a lower return on the NASDAQ, not turning a profit on the Nikkei 225 and a lower average trade duration. (It also under performed on the short side by a small margin).
.
126 Day VHF-VMA, EOD 2 – Smoothing Period Distribution:
.
 .
.
Looking at the smoothing distribution you can see that the range for the VHF-VMA of just 5 – 43 is much smaller than the FRAMA. In fact the entire VHF-VMA range covers only 68% of the FRAMA smoothing periods. The median for the VHF-VMA is also lower which explains why it produces a shorter average trade duration.
.
126 Day VHF-VMA, 2 – Alpha Comparison
.
To get an idea of the readings that created these results we charted a section of the alpha for the 126 Day VHF-VMA, 2 and compared it to the best performing FRAMA to see if there were any similarities that would reveal what makes a good volatility index:
.

.
The alpha pattern is not dissimilar for the 126 Day FRAMA 4, 300 and the 126 Day VHF-VMA 2 which explains why they produce comparable results. The VHF-VMA however tends to produce higher readings resulting in a faster average and rarely moves to extremes. While the lack of volatility from the VHF-VMA reading is a positive, it provides little variation in the smoothing period as the market changes.
.
Conclusion
.
The VHF-VMA does produce good returns and helps to further prove the validity of Variable Moving Averages in general. However we found its performance to be slightly lower than the 126 Day FRAMA, EOD 4, 300 in almost every respect and therefore the Vertical Horizontal Filter Variable Moving Average does not warrant use as a trading tool.
Want to have a play with this indicator anyway? Get a free Excel spreadsheet at the flowing link under Downloads – Technical Indicators: Variable Moving Average (VMA). It will automatically adjust to one of many different VIs that you can select including the Vertical Horizontal Filter used in this article.
.
For more in this series see – Technical Indicator Fight for Supremacy
.
- ~ An entry signal to go long (or exit signal to cover a short) for each average tested was generated with a close above that average and an exit signal (or entry signal to go short) was generated on each close below that moving average. No interest was earned while in cash and no allowance has been made for transaction costs or slippage. Trades were tested using End Of Day (EOD) signals on Daily data. Eg. Daily data with EOD signals requires the Daily price to close above a Daily Moving Average to open a long or close a short and vice versa.
- ^ This was the average annualized return of the 16 markets during the testing period. The data used for these tests is included in the results spreadsheet and more details about our methodology can be found here.

