Fractal Dimension Variable Moving Average (D-VMA) – Test Results

The Variable Moving Average (VMA) dynamically adjusts its own smoothing period to the changing market conditions based on a Volatility Index (VI).  While any VI can be used, in this article we will look at how the VMA performs using the Fractal Dimension (D).  This measure was originally used by John F Ehlers as a component in his Fractal Adaptive Moving Average (FRAMA) which has so far set the standard in our moving average tests.

We did have to make one slight modification to the Fractal Dimension however.  The Volatility index in a VMA needs to shift through a 0 – 1 range where higher readings indicate a stronger trend.  The Fractal Dimension shifts through a 1 – 2 range where lower readings indicate a stronger trend.  Therefore we shall use = ABS(D – 2).

The D-VMA requires two user selected inputs: A Fractal Dimension Period and a VMA period.  We tested trades going Long and Short, using Daily data, taking End Of Day (EOD) and End Of Week (EOW) signals~ analyzing all combinations of:

D = 10, 20, 40, 80, 126, 252

VMA = 5, 10, 15, 20, 25, 30, 35, 40, 45, 50

The D lengths were selected due to the fact that they correspond with the approximate number of trading days in standard calendar periods: 10 days = 2 weeks, 20 days = 1 month, 40 days = 2 months, 80 days = ⅓ year, 126 days = ½ year and there are 252 trading days in an average year.

The VMA periods were selected after preliminary tests showed that when combined with the different ER lengths they resulted in median smoothing periods between 12 and 133 days; a range that should capture the best results based on what we know from previous research into moving averages.

A total of 240 different averages were tested and each one was run through 300 years of data across 16 different global indexes (details here).

Download A FREE Spreadsheet With Raw Data For

All 240 D-VMA Long and Short Test Results

.

D Variable Moving Average EOD vs EOW Returns:

.Fractal Dimension Variable Moving Average - Average Annualized Return, Long

.

It must be noted that every single D-VMA using EOD or EOW signals managed to outperform the average buy and hold annualized return of 6.32%^ during the test period (before allowing for transaction costs and slippage).  This is very impressive when you consider that most fund managers fail to out perform a simple buy and hold approach.

Clearly the D periods of 126 and 252 produced the best results using both EOD and EOW signals.  This echoes previous results on other ‘intelligent’ moving averages.  The 126 Day D-VMA with a constant of 10 stands out as the best performer with EOD signals while the 252 Day D-VMA with a constant of 30 was the best when taking EOW signals.

Because the returns hold up so well when using EOW signals lets take a closer look at the how the probability of profit and trade duration compares for EOD and EOW signals with a D of 126 and 252:

.

Fractal Dimension VMA - Probability of Profit and Average Trade Duration, Long.

Clearly there is a large jump in the probability of profit and the average trade duration when using EOW signals; both are highly desirable characteristics especially if they can be achieved without sacrificing too much return.

.

Best EOD Efficiency Ratio Variable Moving Average

.

126 Day D-VMA EOD, 10 Long.

I have included on the above chart the performance of the 126 Day FRAMA, EOD 4, 300 Long becuase so far this has been the best performing Moving Average.  The 126 Day D-VMA, EOD 10, Long produced almost identical results to the best that the FRAMA could produce and there is really very little between the two.

.

126 Day D-VMA, EOD 10 – Smoothing Period Distribution

.

126 Day D-VMA, EOD 10 - Smoothing Period Distribution.

The smoothing distribution for the two averages has a similar shape but the D-VMA starts from 10 and the FRAMA starts from 4.

.

126 Day D-VMA, 1 – Alpha Comparison

.

To get an idea of the readings that created these results we charted a section of the alpha for the 126 Day D-VMA, 1 and compared it to the best performing FRAMA to see if there were any similarities that would reveal what makes a good volatility index:

.

126 Day D-VMA, 10 - Alpha Comparison.

It is not surprising that the shapes of the alpha readings are almost identical because they are both based on the same Fractal Dimension reading.  The only real difference is that the FRAMA tends to move to extremes more readily.

.

Best EOW Efficiency Ratio Variable Moving Average

.

252 Day D-VMA EOW, 30 Long.

I have included on the above chart the performance of the 252 Day FRAMA, EOW 40, 250 Long becuase so far this has been the best performing ‘slower’ Moving Average.  The 252 Day D-VMA, EOW 30, produced almost the exact same results but did under perform ever so slightly.

.

252 Day D-VMA, EOW 30 – Smoothing Period Distribution

.

252 Day D-VMA, 30 - Smoothing Period Distribution.

The smoothing distribution for the 252 Day D-VMA, 30 is more spread than that of the FRAMA but is still very similar.

.

252 Day D-VMA, 30 – Alpha Comparison

.

252 Day D-VMA, 10 - Alpha Comparison.

Not surprisingly you can see the close similarity between the alpha readings for the D-VMA and the FRAMA thus the similar performance.

.

Conclusion

.

The fact that the D-VMA produces almost the exact same results to the FRAMA shows that the volatility index is more important than the method for translating those readings into an ‘intelligent’ moving average.  However because the FRAMA offers more control and fractionally better returns it remains the best moving average we have found so far.

Want to use the Fractal Dimension Variable Moving Average?   Get a free Excel spreadsheet at the flowing link under Downloads – Technical Indicators: Variable Moving Average (VMA).  It will automatically adjust to one of many different VIs that you can select including the Fractal Dimension used in this article.

.

For more in this series see – Technical Indicator Fight for Supremacy

.

  • ~ An entry signal to go long (or exit signal to cover a short) for each average tested was generated with a close above that average and an exit signal (or entry signal to go short) was generated on each close below that moving average. No interest was earned while in cash and no allowance has been made for transaction costs or slippage. Trades were tested using End Of Day (EOD) and End Of Week (EOW) signals on Daily data. Eg. Daily data with an EOW signal would require the Week to finish above a Daily Moving Average to open a long or close a short while Daily data with EOD signals would require the Daily price to close above a Daily Moving Average to open a long or close a short and vice versa.
  • ^ This was the average annualized return of the 16 markets during the testing period. The data used for these tests is included in the results spreadsheet and more details about our methodology can be found here.

252 Day ER-AMA, 9 – Alpha Comparison

Relative Volatility Index Variable MA (RVI-VMA) – Test Results

The Variable Moving Average (VMA) dynamically adjusts its own smoothing period to the changing market conditions based on a Volatility Index (VI).  While any VI can be used, in this article we will look at how the VMA performs using the Relative Volatility Index (RVI).

The RVI-VMA requires three user selected inputs: A Standard Deviation (SD) period, a Wilder’s Smoothing (WS) period and a VMA constant.  We tested trades going Long using Daily data taking End Of Day (EOD) signals~ analyzing all combinations of:

SD = 10, 20, 40, 80, 126, 252

WS = 9, 14, 19

VMA = 5, 10, 15, 20, 25, 30, 35, 40, 45, 50

The SD lengths were selected due to the fact that they correspond with the approximate number of trading days in standard calendar periods: 10 days = 2 weeks, 20 days = 1 month, 40 days = 2 months, 80 days = ⅓ year, 126 days = ½ year and there are 252 trading days in an average year.

The WS periods were selected because the standard setting for a RVI is 14 and it makes sense to test a few days either side of this in search of the best option.

The VMA periods were selected after preliminary tests showed that when combined with the different SD lengths they resulted in median smoothing periods between 3 and 173 days; a range that should capture the best results based on what we know from previous research into moving averages.

A total of 180 different averages were tested and each one was run through 300 years of data across 16 different global indexes (details here).

Download A FREE Spreadsheet With Raw Data For

All 180 RVI-VMA Long and Short Test Results

.

RVI Variable Moving Average EOD Returns, Long:

.RVI-VMA Annualized Return - Long, WS Period Comparison

.

As with our previous VMA tests, every single RVI-VMA using EOD signals outperformed the average buy and hold annualized return of 6.32%^ during the test period (before allowing for transaction costs and slippage).

The charts above are split into three sets according to their WS period.  Each set reveals very similar results but, low and behold the standard setting of 14 proved the best by a small margin.

To our surprise the Standard Deviation period didn’t really matter and despite testing a huge range from 10 days to 252 days, all the results were very similar.  So we decided to select 126 days as the best SD period becuase it has been the best Volatility Index setting in several previous VMA tests.

For the VMA constant, a period of 10 stood out as producing the best results across the board.  Therefore we want a RVI-VMA within a SD period of 126, a WS period of 14 and a VMA constant of 10:

.

Best EOD Relative Volatility Index Variable Moving Average:

.

126, 14 Day RVI-VMA, EOD 10, Long.

I have included on the above chart the performance of the 126 Day FRAMA, EOD 4, 300 Long becuase so far this has been the best performing Moving Average.  The 126, 14 Day RVI-VMA, EOD 10, Long can’t compare in terms of performance with the FRAMA and offers no outstanding attributes in any other areas.

.

126, 14 Day RVI-VMA, EOD 10 – Smoothing Period Distribution:

.

126 Day RVI-VMA, EOD 10 – Smoothing Period Distribution.

The RVI-VMA is very localized around its median smoothing period of 20.  Almost the entire distribution (96%) is covered with a 12 – 31 range which only represents 28% of the smoothing for the better performing FRAMA.

.

126, 14 Day RVI-VMA, 10 – Alpha Comparison

.

To get an idea of the readings that created these results we charted a section of the alpha for the 126, 14 Day RVI-VMA, 10 and compared it to the best performing FRAMA to see if there were any similarities that would reveal what makes a good volatility index:

.

126 Day ER-VMA, 1 – Alpha Comparison.

As you can see the Alpha for the 126, 14 Day RVI-VMA, 10 is very volatile but stays within a tight range.  The better performing 126 Day FRAMA 4, 300 on the other hand produces readings that are much more stable however they do move to extremes upon occasion resulting in a more ‘Variable’ Moving Average.

.

Conclusion

.

The RVI-VMA outperformed a buy and hold approach in our tests but is nowhere neat as effective as the FRAMA and therefore is not worthy of being used as a trading tool.

Want to have a play with this indicator anyway?  Get a free Excel spreadsheet at the flowing link under Downloads – Technical Indicators: Variable Moving Average (VMA).  It will automatically adjust to one of many different VIs that you can select including the Relative Volatility Index featured in this article.

.

For more in this series see – Technical Indicator Fight for Supremacy

.

  • ~ An entry signal to go long for each average tested was generated with a close above that average and an exit signal was generated on each close below that moving average. No interest was earned while in cash and no allowance has been made for transaction costs or slippage. Trades were tested using End Of Day (EOD) signals on Daily data. Eg. Daily data with EOD signals requires the Daily price to close above a Daily Moving Average to open a long and vice versa.
  • ^ This was the average annualized return of the 16 markets during the testing period. The data used for these tests is included in the results spreadsheet and more details about our methodology can be found here.

Vertical Horizontal Filter Variable MA (VHF-VMA) – Test Results

The Variable Moving Average (VMA) dynamically adjusts its own smoothing period to the changing market conditions based on a Volatility Index (VI).  While any VI can be used, in this article we will look at how the VMA performs using a Vertical Horizontal Filter (VHF).

The VHF-VMA requires two user selected inputs: A Vertical Horizontal Filter Period and a VMA period.  We tested trades going Long and Short using Daily data taking End Of Day (EOD) signals~ analyzing all combinations of:

VHF = 10, 20, 40, 80, 126, 252

VMA = 1 – 20

The VHF lengths were selected due to the fact that they correspond with the approximate number of trading days in standard calendar periods: 10 days = 2 weeks, 20 days = 1 month, 40 days = 2 months, 80 days = ⅓ year, 126 days = ½ year and there are 252 trading days in an average year.

The VMA periods were selected after preliminary tests showed that when combined with the different VHF lengths they resulted in median smoothing periods between 3 and 173 days; a range that should capture the best results based on what we know from previous research into moving averages.

A total of 160 different averages were tested and each one was run through 300 years of data across 16 different global indexes (details here).

Download A FREE Spreadsheet With Raw Data For

All 160 VHF-VMA Long and Short Test Results

.

VHF Variable Moving Average EOD Returns, Long:

.VHF-VMA Annualized Return EOD, Long

.

As with previous VMA test, every single VHF-VMA using EOD signals managed to outperform the average buy and hold annualized return of 6.32%^ during the test period (before allowing for transaction costs and slippage).

The VHF periods of 126, 252 and 80 produced the best results when the VMA period was 10 or less while the highest returns came from a VHF period of 126 and a VMA period of 2.  We have seen in every ‘intelegent’ moving average test so far the predominance of 126 and 252 as the volatility or trend strength indicator settings that produce the best returns.

.

Best EOD Vertical Horizontal Filter Variable Moving Average:

.

126 Day VHF-VMA EOD, 2 Long.

I have included on the above chart the performance of the 126 Day FRAMA, EOD 4, 300 Long becuase so far this has been the best performing Moving Average.  The 126 Day VHF-VMA, EOD 2, Long produced respectable results compared to the best that the FRAMA could produce but still under performed slightly.  Plus there are several other things that go against the 126 Day VHF-VMA, EOD 2 such as a lower return on the NASDAQ, not turning a profit on the Nikkei 225 and a lower average trade duration.  (It also under performed on the short side by a small margin).

.

126 Day VHF-VMA, EOD 2 – Smoothing Period Distribution:

.

126 Day VHF-VMA, 2 - Smoothing Period Distribution.

Looking at the smoothing distribution you can see that the range for the VHF-VMA of just 5 – 43 is much smaller than the FRAMA.  In fact the entire VHF-VMA range covers only 68% of the FRAMA smoothing periods.  The median for the VHF-VMA is also lower which explains why it produces a shorter average trade duration.

.

126 Day VHF-VMA, 2 – Alpha Comparison

.

To get an idea of the readings that created these results we charted a section of the alpha for the 126 Day VHF-VMA, 2 and compared it to the best performing FRAMA to see if there were any similarities that would reveal what makes a good volatility index:

.

126 Day VHF-VMA, 2 – Alpha Comparison

.

The alpha pattern is not dissimilar for the 126 Day FRAMA 4, 300 and the 126 Day VHF-VMA 2 which explains why they produce comparable results.  The VHF-VMA however tends to produce higher readings resulting in a faster average and rarely moves to extremes.  While the lack of volatility from the VHF-VMA reading is a positive, it provides little variation in the smoothing period as the market changes.

.

Conclusion

.

The VHF-VMA does produce good returns and helps to further prove the validity of Variable Moving Averages in general.  However we found its performance to be slightly lower than the 126 Day FRAMA, EOD 4, 300 in almost every respect and therefore the Vertical Horizontal Filter Variable Moving Average does not warrant use as a trading tool.

Want to have a play with this indicator anyway?  Get a free Excel spreadsheet at the flowing link under Downloads – Technical Indicators: Variable Moving Average (VMA).  It will automatically adjust to one of many different VIs that you can select including the Vertical Horizontal Filter used in this article.

.

For more in this series see – Technical Indicator Fight for Supremacy

.

  • ~ An entry signal to go long (or exit signal to cover a short) for each average tested was generated with a close above that average and an exit signal (or entry signal to go short) was generated on each close below that moving average. No interest was earned while in cash and no allowance has been made for transaction costs or slippage. Trades were tested using End Of Day (EOD) signals on Daily data. Eg. Daily data with EOD signals requires the Daily price to close above a Daily Moving Average to open a long or close a short and vice versa.
  • ^ This was the average annualized return of the 16 markets during the testing period. The data used for these tests is included in the results spreadsheet and more details about our methodology can be found here.

Efficiency Ratio Variable Moving Average (ER-VMA) – Test Results

The Variable Moving Average (VMA) dynamically adjusts its own smoothing period to the changing market conditions based on a Volatility Index (VI).  While any VI can be used, in this article we will look at how the VMA performs using an Efficiency Ratio (ER).  This is identical to the modified CMO that Tushar S. Chande suggested be used in his October 1995 article in Technical Analysis of Stocks & Commodities – ‘Identifying Powerful Breakouts Early‘.

The ER-VMA requires two user selected inputs: An Efficiency Ratio Period and a VMA period.  We tested trades going Long and Short, using Daily data, taking End Of Day (EOD) and End Of Week (EOW) signals~ analyzing all combinations of:

ER = 10, 20, 40, 80, 126, 252

VMA = 1, 2, 3, 4, 5, 6, 7, 8, 9, 10

The ER lengths were selected due to the fact that they correspond with the approximate number of trading days in standard calendar periods: 10 days = 2 weeks, 20 days = 1 month, 40 days = 2 months, 80 days = ⅓ year, 126 days = ½ year and there are 252 trading days in an average year.

The VMA periods were selected after preliminary tests showed that when combined with the different ER lengths they resulted in median smoothing periods between 6 and 207 days; a range that should capture the best results based on what we know from previous research into moving averages.

A total of 240 different averages were tested and each one was run through 300 years of data across 16 different global indexes (details here).

Download A FREE Spreadsheet With Raw Data For

All 240 ER-VMA Long and Short Test Results

.

ER Variable Moving Average EOD vs EOW Returns:

.Efficiency Ratio Variable Moving Average - Average Annualized Return, Long

.

As with previous VMA test, every single ER-VMA using EOD signals managed to outperform the average buy and hold annualized return of 6.32%^ during the test period (before allowing for transaction costs and slippage).

Clearly the ER periods of 126 and 252 produced the best results using both EOD and EOW signals.  This echoes previous results on other ‘intelligent’ moving averages.  The 126 Day ER-VMA with a constant of 1 stands out as the best performer with EOD signals while the 252 Day ER-VMA with a constant of 9 was the best when taking EOW signals.  (The results on the short side reiterate this).

It is interesting to note that the returns hold up quite well when using EOW signals on a 252 ER so lets take a closer look at the how the probability of profit and trade duration compares for EOD and EOW signals:

.

Efficiency Ratio VMA - Probability of Profit and Average Trade Duration, Long

.

Clearly there is a large jump in the probability of profit and the average trade duration when using EOW signals; both are highly desirable characteristics especially if they can be achieved without sacrificing too much return.

.

Best EOD Efficiency Ratio Variable Moving Average

.

126 Day ER-VMA EOD, 1 Long.

I have included on the above chart the performance of the 126 Day FRAMA, EOD 4, 300 Long becuase so far this has been the best performing Moving Average.  The 126 Day ER-VMA, EOD 1, Long produced almost identical results to the best that the FRAMA could produce but still under performs slightly (The same is true on the short side).  Plus there are other little things that go against the 126 Day ER-VMA, EOD 1 like a slight increase in the biggest loss and not turning a profit on the Nikkei 225.

.

126 Day ER-VMA, EOD 1 – Smoothing Period Distribution

.

.

Looking at the smoothing distribution you can see it is quite similar to the FRAMA but with a lower median and a MASSIVE range.

.

126 Day ER-VMA, 1 – Alpha Comparison

.

To get an idea of the readings that created these results we charted a section of the alpha for the 126 Day ER-VMA, 1 and compared it to the best performing FRAMA to see if there were any similarities that would reveal what makes a good volatility index:

.

126 Day ER-VMA, 1 - Alpha Comparison

.

The alpha does have a very similar pattern for both the 126 Day FRAMA 4, 300 and the 126 Day ER-VMA 1 and this further helps to explain why their performance is so similar.  Notice however that the FRAMA is far less volatile.  It is always preferable to work with indicators that generate clean readings with low levels of noise assuming they still produce good results.

.

Best EOW Efficiency Ratio Variable Moving Average

.

252 Day ER-VMA, EOW 9, Long

.

I have included on the above chart the performance of the 252 Day FRAMA, EOW 40, 250 Long becuase so far this has been the best performing ‘slower’ Moving Average.  The 252 Day ER-VMA, EOW 9, under performs by a small amount by almost every measure but it does offer a longer average trade duration of 86 days compared to 63 days for the FRAMA.  This makes the 252 Day ER-VMA, EOW 9 a very strong candidate as the best ‘slower’ moving average although its performance on the short side under performs by a slightly greater margin.

.

252 Day ER-VMA, EOW 9 – Smoothing Period Distribution

.

252 Day ER-VMA, 9 - Smoothing Period Distribution.

Looking at the smoothing distribution for the 252 Day ER-VMA, 9 you can see that it is far more spread out with just 33% of its the periods covered in the first 50 data points while the same range covers 82% for the FRAMA.  It also has a much higher median smoothing period of 119 compared to 52 for the FRAMA which explains why it has a longer average trade duration.

.

252 Day ER-VMA, 9 – Alpha Comparison

.

252 Day ER-VMA, 9 - Alpha Comparison.

This time we see that the alphas are very different but once again the FRAMA is far less volatile.  Remember the higher the reading the faster the resulting smoothing period; the ER-VMA stays much lower than the FRAMA which results in a slower average.

.

Conclusion

.

The ER-VMA produces some impressive returns and gives the FRAMA a good run for its money.  For a ‘fast’ moving average the 126 Day FRAMA, EOD 4, 300 is definitely superior to the 126 Day ER-VMA, 1 because it outperforms by almost every measure and is guided by readings (D) that are far less volatile.

For the ‘slower’ moving average it is more difficult to select the winner.  I like the fact that the 252 ER-VMA, 9 has a much more even distribution of smoothing and a longer average trade duration.  However it is unfortunate that there is so much more noise in the readings (ER) that guide it.  The ER-VMA certainly warrens mention and perhaps further research but based on our findings so far the FRAMA remains slightly superior in almost every way.

Want to use this indicator?  Get a free Excel spreadsheet at the flowing link under Downloads – Technical Indicators: Variable Moving Average (VMA).  It will automatically adjust to one of many different VIs that you can select including the Efficiency Ratio used in this article.

.

For more in this series see – Technical Indicator Fight for Supremacy

.

  • ~ An entry signal to go long (or exit signal to cover a short) for each average tested was generated with a close above that average and an exit signal (or entry signal to go short) was generated on each close below that moving average. No interest was earned while in cash and no allowance has been made for transaction costs or slippage. Trades were tested using End Of Day (EOD) and End Of Week (EOW) signals on Daily data. Eg. Daily data with an EOW signal would require the Week to finish above a Daily Moving Average to open a long or close a short while Daily data with EOD signals would require the Daily price to close above a Daily Moving Average to open a long or close a short and vice versa.
  • ^ This was the average annualized return of the 16 markets during the testing period. The data used for these tests is included in the results spreadsheet and more details about our methodology can be found here.

252 Day ER-AMA, 9 – Alpha Comparison

Standard Deviation Ratio Variable Moving Ave (SDR-VMA) – Test Results

The Variable Moving Average (VMA) dynamically adjusts its own smoothing period to the changing market conditions based on a Volatility Index (VI).  While any VI can be used, in this article we will look at how the VMA performs using a Standard Deviation Ratio (SDR).  This is the VI that Tushar S. Chande first suggested be used when he presented what he called a Volatility Index Dynamic Average (VIDYA) in the March 1992 edition of Technical Analysis of Stocks & Commodities – Adapting Moving Averages To Market Volatility.

The SDR-VMA requires three user selected inputs: A Short Standard Deviation (SD1), a Longer Standard Deviation (SD2) and a VMA period.  We tested trades going Long and Short, using Daily data, taking End Of Day (EOD) and End Of Week (EOW) signals~ analyzing all combinations of:

SD1 = 10, 20, 40, 80, 126

SD2 = 20, 40, 80, 126, 252

VMA = 5, 10, 15, 20, 25, 30, 35, 40, 45, 50

The SD lengths were selected due to the fact that they correspond with the approximate number of trading days in standard calendar periods: 10 days = 2 weeks, 20 days = 1 month, 40 days = 2 months, 80 days = ⅓ year, 126 days = ½ year and there are 252 trading days in an average year.

The VMA periods were selected after preliminary tests showed that when combined with the different SDR combinations, these settings resulted in a median smoothing period between 6 and 280 days; a range that should capture the best results based on what we know from previous research into moving averages.

A total of 390 different averages were tested and each one was run through 300 years of data across 16 different global indexes (details here).

Download A FREE Spreadsheet With Raw Data For

All 390 SDR-VMA Long and Short Test Results

.

SDR Variable Moving Average Test Results, Daily EOD, Long:

.

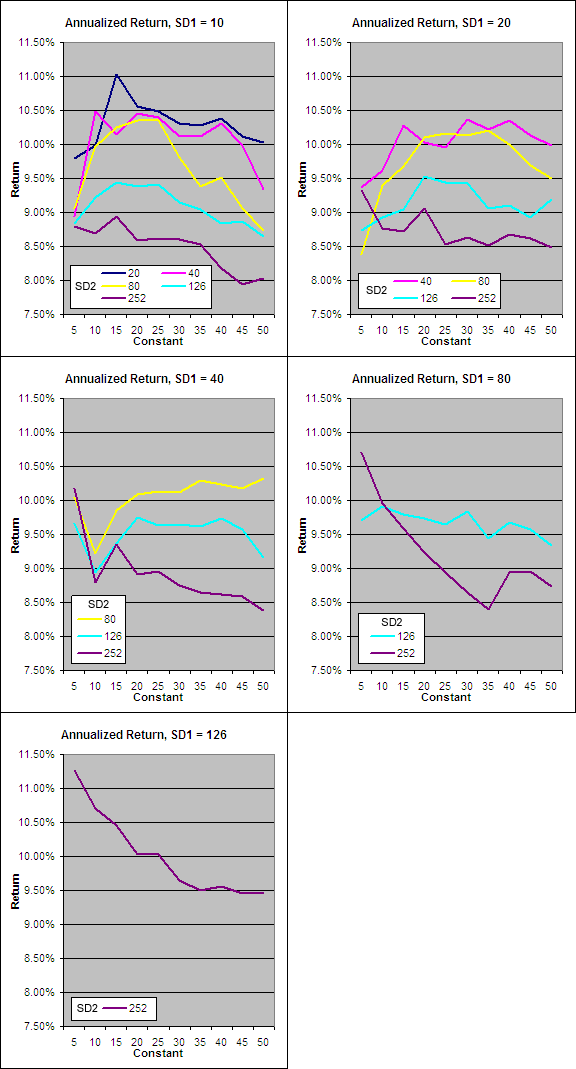
The data collected from our tests has been split by SD1 length with return plotted on the “y” axis, the VMA constant on the “x” axis and a separate series displayed for each SD2 length.

.

VIDYA Annualized Return.

First up it must be noted that every single SDR-VMA Long using EOD signals on Daily data outperformed the average buy and hold annualized return of 6.32%^ during the test period (before allowing for transaction costs and slippage).  This is a vote of confidence for the concept especially seeing as each average was typically sitting in cash 37% of the time.

Perhaps the most interesting information from the data however is the fact that the best performer from each set had a SD2 that was twice the length of SD1.  This formula of SD2 = 2*SD1 should therefore be used whenever utilizing the Standard Deviation Ratio.

.

The Best SDR-VMA Parameters

.

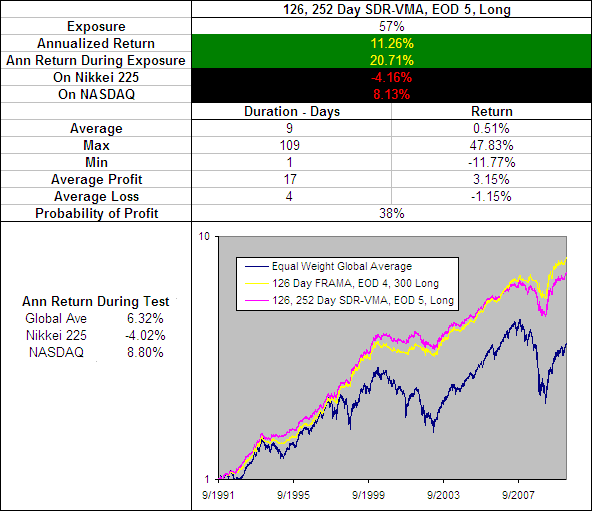
The best performing average was found where SD1 = 126, SD2 = 252 and the VMA constant = 5.  In the FRAMA tests we also saw that the periods of 126 (half a year) and 252 (a full trading year) produced the best results so this appears to be a reoccurring theme:

.

126, 252 Day SDR-VMA, EOD 5, Long.

I have included on the above chart the performance of the 126 Day FRAMA, EOD 4, 300 Long becuase so far this has been the best performing Moving Average and as you can see the SDR-VMA under performs.  To make matters worse it has an typical trade duration of just 9 days compared to the FRAMA’s 14, and underperformed the buy and hold returns of both the Nikkei 225 and the NASDAQ.  Therefore we can conclude that the SDR-VMA, despite being effective is not as good as the FRAMA.

.

A look at the Smoothing Period:

.

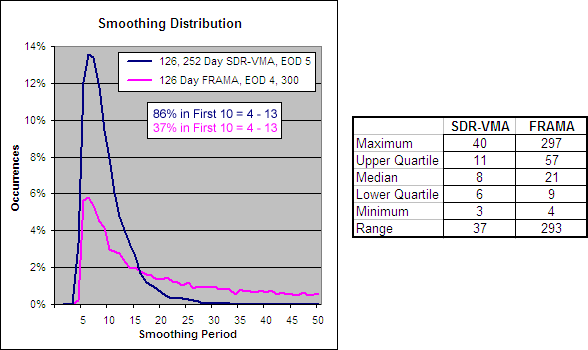
126, 252 Day SDR-VMA, EOD 5 - Smoothing Period Distribution.

By looking at the smoothing distribution you can see why the SDR-VMA is so much faster than the FRAMA.  While the FRAMA has a range of 293 days and a median of 21, the SDR-VMA has a range of just 37 days and a median of 8.

.

126, 252 Day SDR-VMA, 5 – Alpha Comparison

.

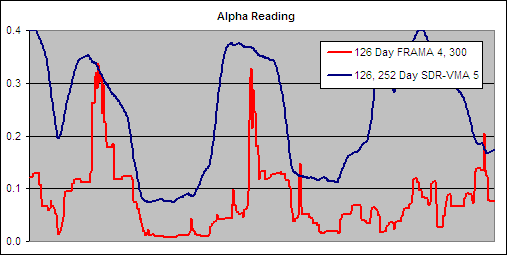
To get an idea of the readings that created these results we charted a section of the alpha for the 126, 252 Day SDR-VMA, 5 and compared it to the best performing FRAMA to see if there were any similarities that would reveal what makes a good volatility index:

.

126, 252 Day SDR-VMA, 5 - Alpha Comparison.

The alpha patterns are similar for both the 126 Day FRAMA 4, 300 and the 126, 252 Day SDR-VMA 5 but the readings are still very different.  The SDR-VMA’s indicator is nearly always higher than the FRAMA’s which is why the resulting VMA is much faster.

It is desirable to see however that the SDR-VMA’s alpha is so clean and noise free in its movements.  This leads me to believe that the 126, 252 SDR would be a good VI if it were adjusted to produce a slower average.  Also due to the lack of noise from the SDR it may offer value in other applications such a way of ranking a universe of stocks by their trend strength, but that is the topic of another set of tests.

.

For more in this series see – Technical Indicator Fight for Supremacy

.

  • ~ An entry signal to go long (or exit signal to cover a short) for each average tested was generated with a close above that average and an exit signal (or entry signal to go short) was generated on each close below that moving average. No interest was earned while in cash and no allowance has been made for transaction costs or slippage.  Trades were tested using End Of Day (EOD) and End Of Week (EOW) signals on Daily data.  Eg. Daily data with an EOW signal would require the Week to finish above a Daily Moving Average to open a long or close a short while Daily data with EOD signals would require the Daily price to close above a Daily Moving Average to open a long or close a short and vice versa.
  • ^ This was the average annualized return of the 16 markets during the testing period. The data used for these tests is included in the results spreadsheet and more details about our methodology can be found here.

Variable Moving Average (VMA) aka Volatility Index Dynamic Ave (VIDYA)

The Variable Moving Average (VMA) aka Volatility Index Dynamic Average (VIDYA) was developed by Tushar S. Chande and first presented in the March 1992 edition of Technical Analysis of Stocks & Commodities – Adapting Moving Averages To Market Volatility

Chande’s theory was that the performance of an exponential moving average could be improved by using a Volatility Index (VI) to adjust the smoothing period as market conditions change.  The idea being that when prices are congested an average should slow down to avoid whipsaws but when prices are trending strongly an average should speed up to capture the major price moves.

He was not the first person to think along these lines; George R. Arrington, Ph.D introduced a variable Simple Moving Average based on Standard Deviation in the June 1991 edition of Technical Analysis of Stocks & Commodities – Building a Variable-Length Moving Average (VLMA).  The YIDYA however represented a massive step forward from the VLMA because it allowed a much larger spread of smoothing periods.

.

How To Calculate a Variable Moving Average

.

VMA = (α * VI * Close) + ((1 – ( α * VI )) * VMA[1])

Where:

α = 2 / (N + 1)

VI = Users choice of a measure of volatility or trend strength.

N = User selected constant smoothing period.

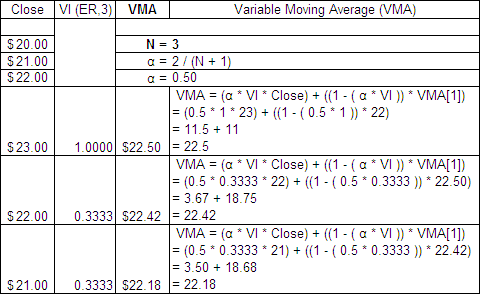
Here is an example of a 3 period VMA with a 3 period Efficiency Ratio (ER) as the VI:

.

Variable Moving Average Formula.

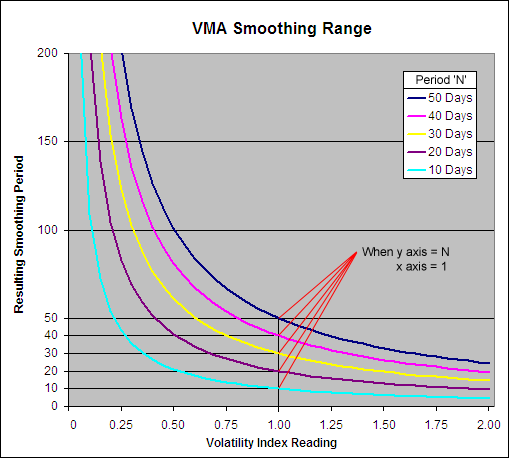
How the VIDYA Smoothing is changed by the Volatility Index

.

The Variable Moving Average is unique in that it has no upper or lower limit to its smoothing period:

.

How the VMA smoothing period works

.

The VMA smoothing period can go infinitely high until the Volatility Index equals zero at which point the resulting average will stop moving and be equal to the previous VMA.  When the Volatility Index equals 1 the smoothing period will be equal to the user selected constant ‘N’; notice how when the Y axis = N, the X axis = 1.

However if the Volatility Index being used can rise above 1 (such as the Standard Deviation Ratio) then the smoothing period can drop below the user selected constant.  When the VI = (N/2) + 0.5 then the smoothing period will be 1, which is equal to the price itself.  Therefore the VI that is used must not rise above (N/2) + 0.5 and if it does upon occasion then this cap must be written into the formula.

.

A Look at the Actual Alpha

.

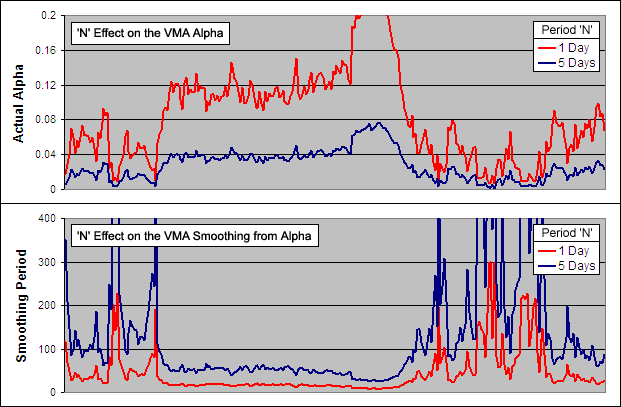
Because the VMA is as the name suggests, variable, the ‘Actual Alpha’ is not static but is influenced by the VI.  By changing the constant ‘N’ however the interpretation of the VI changes greatly:

.

VMA - The effect that N has on Alpha and Smoothing.

Above you can see an example of the ‘Actual Alpha’ and the resulting smoothing period for a VMA with an ‘N’ of 1 and an ‘N’ of 5.  We know that when the VI = 1 (indicating that the stock is trending perfectly) the smoothing period = ‘N’.  So the fastest possible smoothing periods in these examples would be 1 and 5 respectively; not a big difference.  But it is surprising to see what a huge impact changing ‘N’ just a few points has overall.  In fact as ‘N’ increases the resulting VMA moves exponentially slower.  This affect is rather like the squaring used by Kaufman in his Adaptive Moving Average.

.

What Volatility Index to use?

.

Chande originally used the Standard Deviation Ratio as his VI and this is the one typically used when people talk about a VIDYA.  But later on, in the October 1995 article from Technical Analysis of Stocks & Commodities – ‘Identifying Powerful Breakouts Early‘ he suggested the use of his own Chande Momentum Oscillator (CMO).

Because the CMO ranges between 100 and -100, to use it in this application we must take the absolute value divided by 100.  The result is identical to the Efficiency Ratio (ER) and is the VI used most often when people refer to a VMA.  Any measure of volatility or trend strength can be used however as long as it fits between a zero to (N/2) + 0.5 range where higher readings indicate a stronger trend.

.

Volatility Indexes Used for Testing

.

As part of the ‘Technical Indicator Fight for Supremacy‘ we have tested/will test the following indicators as the Volatility Index in a Variable Moving Average:

Are there any others that you think are worth testing?  Please let us know in the comments section at the bottom.

.

Variable Moving Average Excel File

.

I have put together an Excel Spreadsheet containing the Variable Moving Average and made it available for FREE download.  It contains a ‘basic’ version that shows all the working and a ‘fancy’ one that will automatically adjust to the length as well as the Volatility Index you specify.  Find it at the following link near the bottom of the page under Downloads – Technical Indicators: Variable Moving Average (VMA)

.

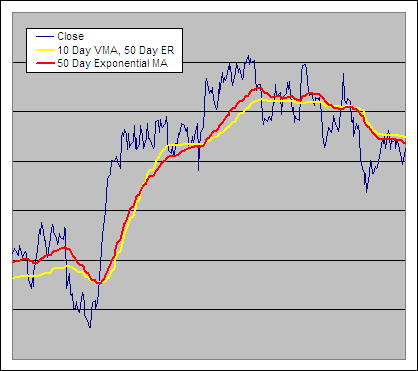
10 Day Variable Moving Average Example, VI = 50 Day Efficiency Ratio

.

Variable Moving Average vs EMA - Example